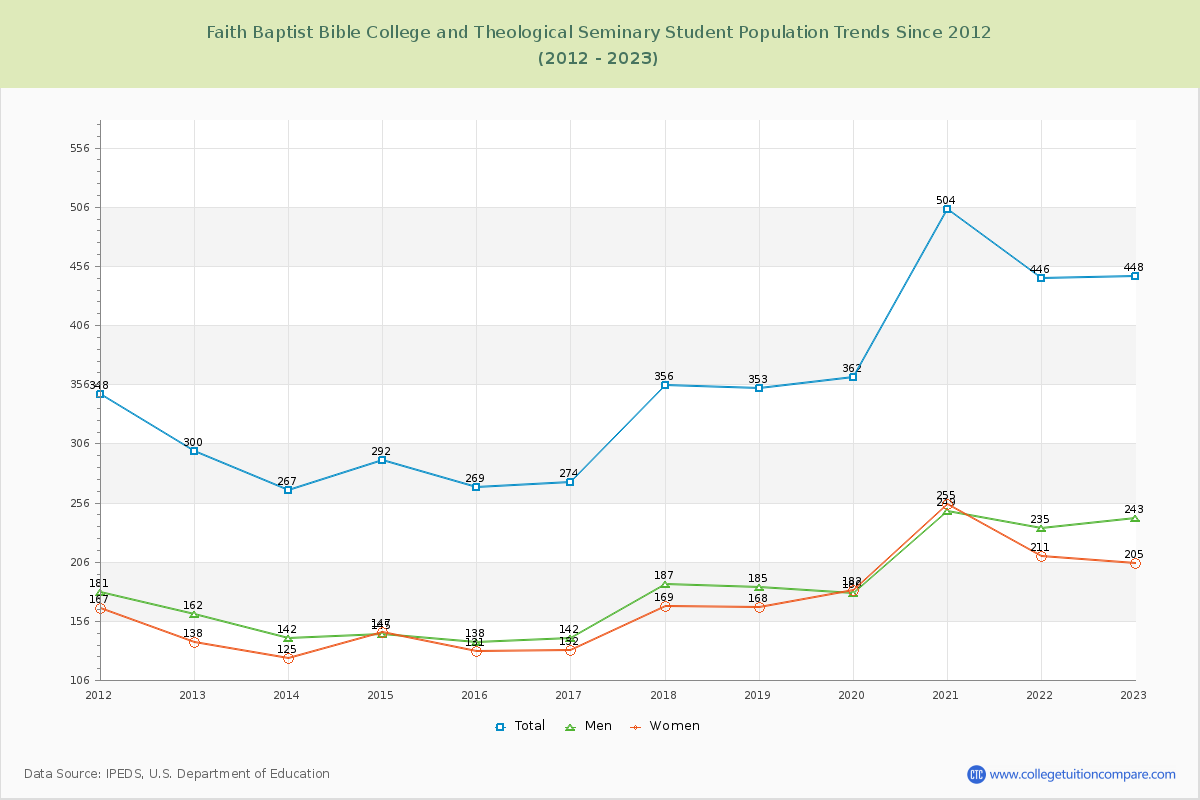
Student Population Changes
The average student population over the last 12 years is 352 where 448 students are attending the school for the academic year 2022-2023.
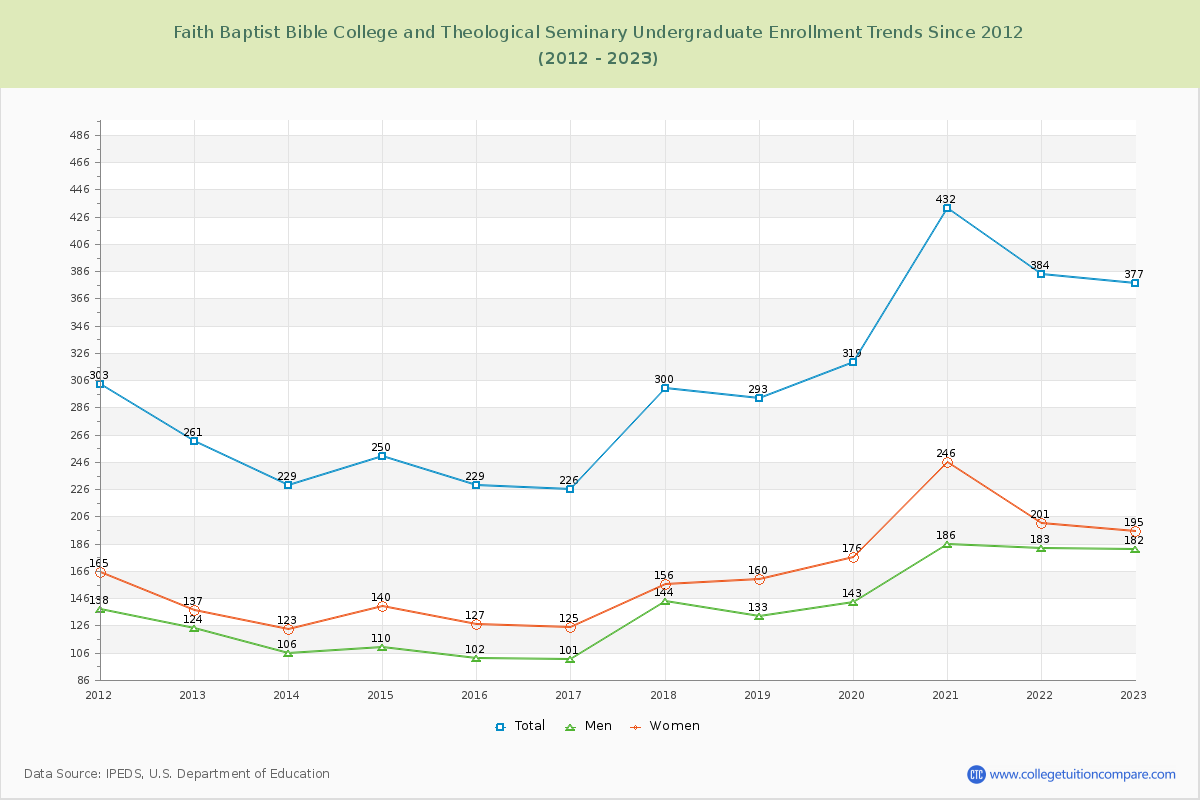
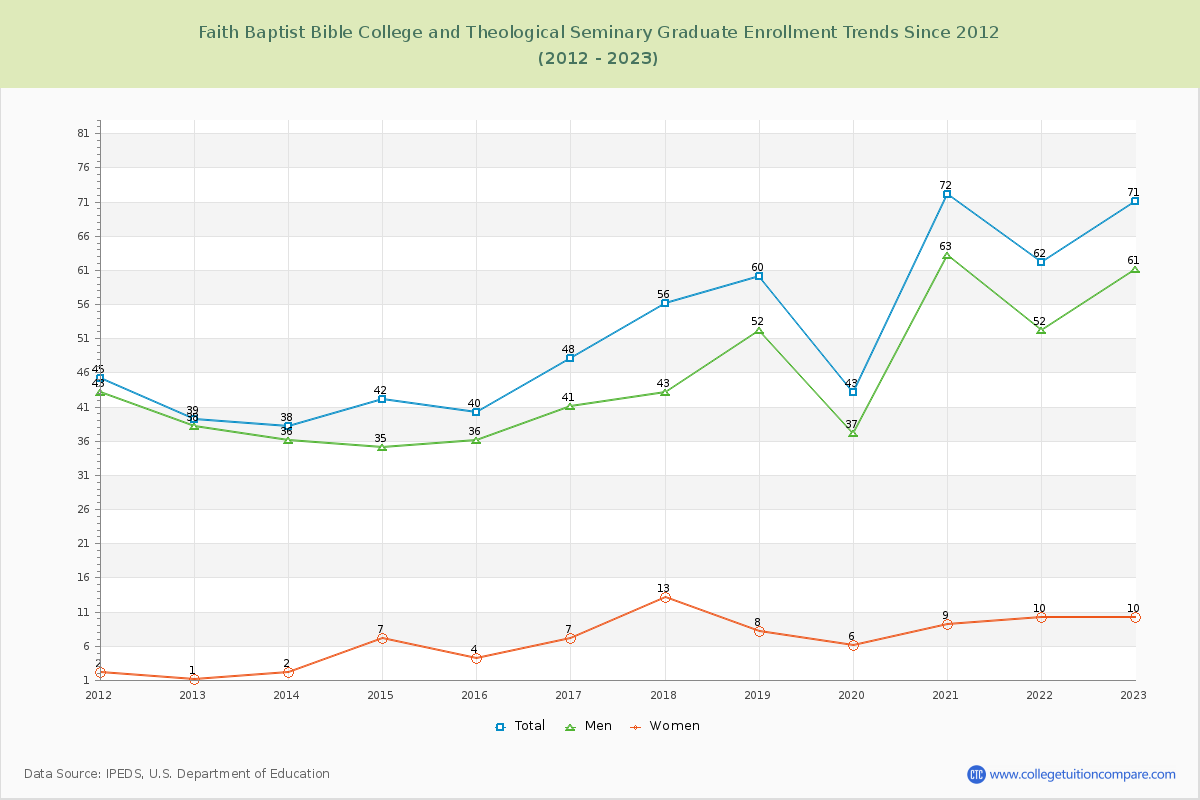
84.15% of total students is undergraduate students and 15.85% students is graduate students. The number of undergraduate students has increased by 116 and the graduate enrollment has increased by 32 over past 10 years.
The female to male ratio is 0.84 to 1 and it means that there are slightly more male students enrolled in FBBC than female students.
The following table and chart illustrate the changes in student population by gender at Faith Baptist Bible College and Theological Seminary since 2012.
| Year | Total | Undergraduate | Graduate | ||||
|---|---|---|---|---|---|---|---|
| Total | Men | Women | Total | Men | Women | ||
| 2012-13 | 300 | 261 | 124 | 137 | 39 | 38 | 1 |
| 2013-14 | 267 -33 | 229 -32 | 106 -18 | 123 -14 | 38 -1 | 36 -2 | 2 1 |
| 2014-15 | 292 25 | 250 21 | 110 4 | 140 17 | 42 4 | 35 -1 | 7 5 |
| 2015-16 | 269 -23 | 229 -21 | 102 -8 | 127 -13 | 40 -2 | 36 1 | 4 -3 |
| 2016-17 | 274 5 | 226 -3 | 101 -1 | 125 -2 | 48 8 | 41 5 | 7 3 |
| 2017-18 | 356 82 | 300 74 | 144 43 | 156 31 | 56 8 | 43 2 | 13 6 |
| 2018-19 | 353 -3 | 293 -7 | 133 -11 | 160 4 | 60 4 | 52 9 | 8 -5 |
| 2019-20 | 362 9 | 319 26 | 143 10 | 176 16 | 43 -17 | 37 -15 | 6 -2 |
| 2020-21 | 504 142 | 432 113 | 186 43 | 246 70 | 72 29 | 63 26 | 9 3 |
| 2021-22 | 446 -58 | 384 -48 | 183 -3 | 201 -45 | 62 -10 | 52 -11 | 10 1 |
| 2022-23 | 448 2 | 377 -7 | 182 -1 | 195 -6 | 71 9 | 61 9 | 10 0 |
| Average | 352 | 300 | 138 | 162 | 52 | 45 | 7 |