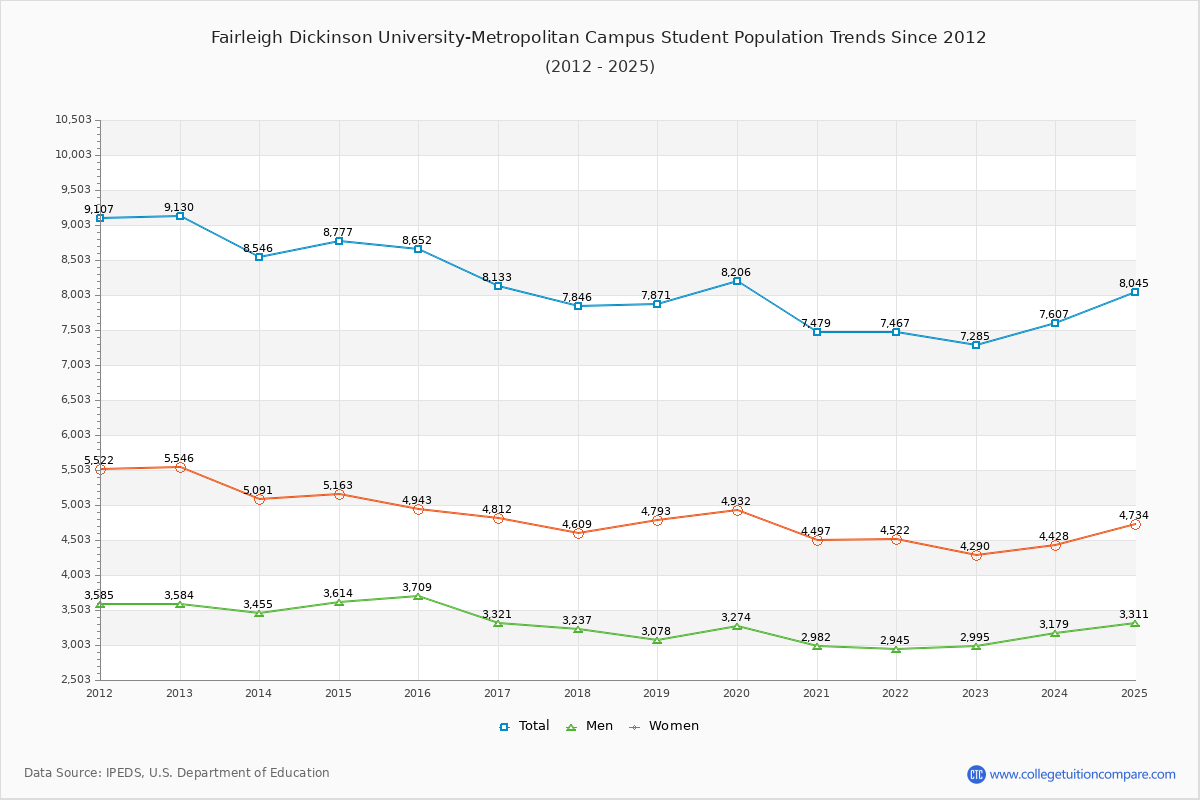
Student Population Changes
The average student population over the last 12 years is 8,127 where 7,285 students are attending the school for the academic year 2022-2023.
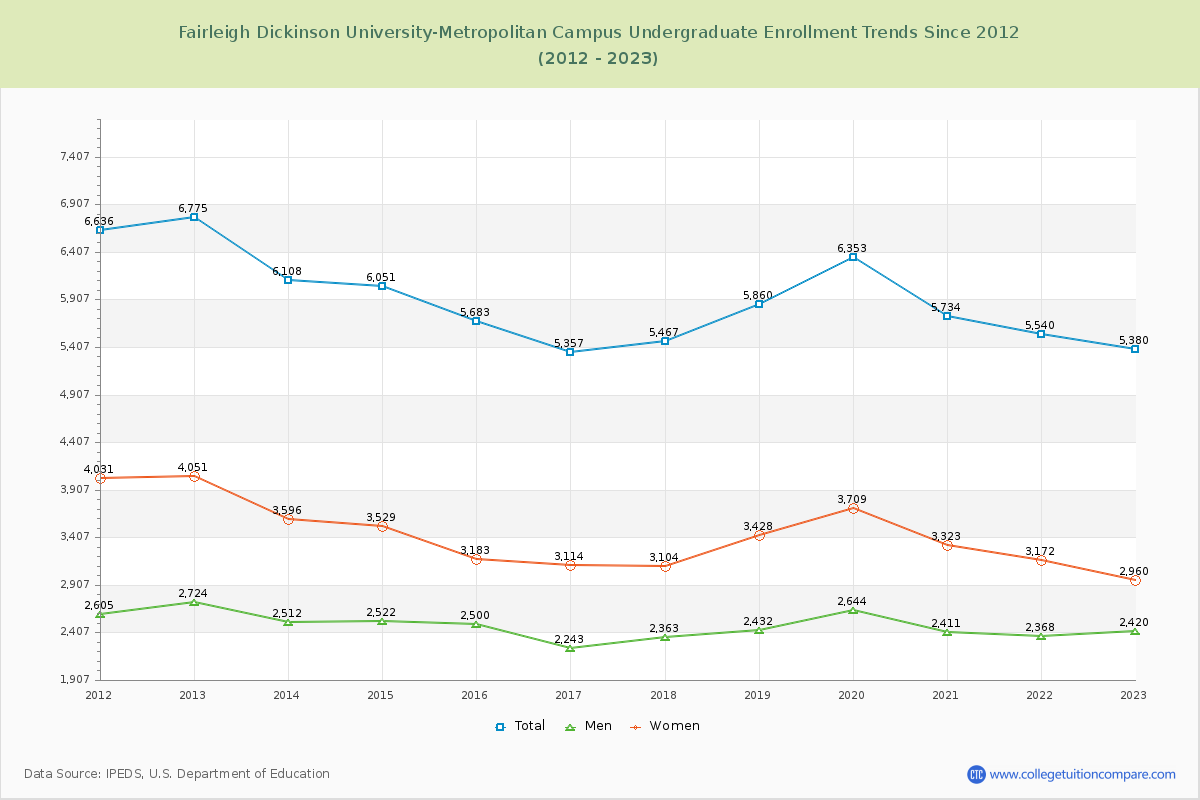
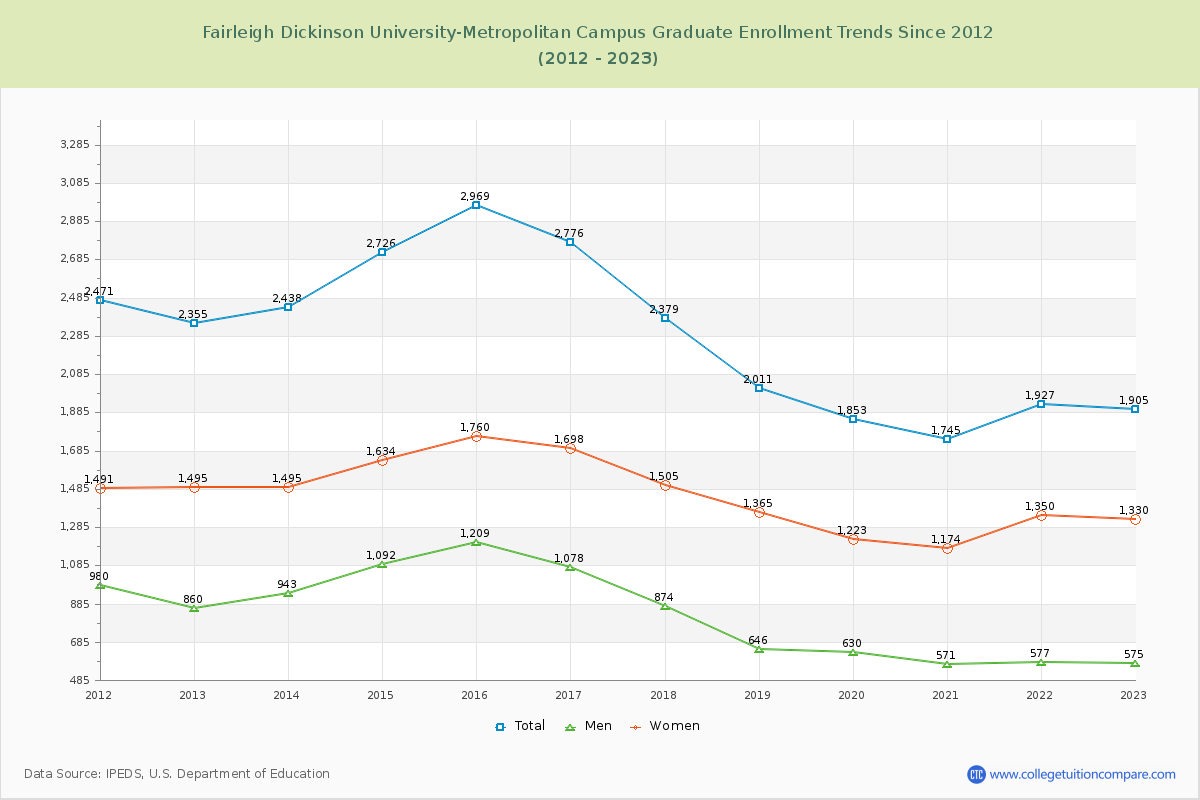
73.85% of total students is undergraduate students and 26.15% students is graduate students. The number of undergraduate students has decreased by 1,395 and the graduate enrollment has decreased by 450 over past 10 years.
The female to male ratio is 1.43 to 1 and it means that there are more female students enrolled in FDU-Metropolitan than male students.
The following table and chart illustrate the changes in student population by gender at Fairleigh Dickinson University-Metropolitan Campus since 2012.
| Year | Total | Undergraduate | Graduate | ||||
|---|---|---|---|---|---|---|---|
| Total | Men | Women | Total | Men | Women | ||
| 2012-13 | 9,130 | 6,775 | 2,724 | 4,051 | 2,355 | 860 | 1,495 |
| 2013-14 | 8,546 -584 | 6,108 -667 | 2,512 -212 | 3,596 -455 | 2,438 83 | 943 83 | 1,495 0 |
| 2014-15 | 8,777 231 | 6,051 -57 | 2,522 10 | 3,529 -67 | 2,726 288 | 1,092 149 | 1,634 139 |
| 2015-16 | 8,652 -125 | 5,683 -368 | 2,500 -22 | 3,183 -346 | 2,969 243 | 1,209 117 | 1,760 126 |
| 2016-17 | 8,133 -519 | 5,357 -326 | 2,243 -257 | 3,114 -69 | 2,776 -193 | 1,078 -131 | 1,698 -62 |
| 2017-18 | 7,846 -287 | 5,467 110 | 2,363 120 | 3,104 -10 | 2,379 -397 | 874 -204 | 1,505 -193 |
| 2018-19 | 7,871 25 | 5,860 393 | 2,432 69 | 3,428 324 | 2,011 -368 | 646 -228 | 1,365 -140 |
| 2019-20 | 8,206 335 | 6,353 493 | 2,644 212 | 3,709 281 | 1,853 -158 | 630 -16 | 1,223 -142 |
| 2020-21 | 7,479 -727 | 5,734 -619 | 2,411 -233 | 3,323 -386 | 1,745 -108 | 571 -59 | 1,174 -49 |
| 2021-22 | 7,467 -12 | 5,540 -194 | 2,368 -43 | 3,172 -151 | 1,927 182 | 577 6 | 1,350 176 |
| 2022-23 | 7,285 -182 | 5,380 -160 | 2,420 52 | 2,960 -212 | 1,905 -22 | 575 -2 | 1,330 -20 |
| Average | 8,127 | 5,846 | 2,467 | 3,379 | 2,280 | 823 | 1,457 |