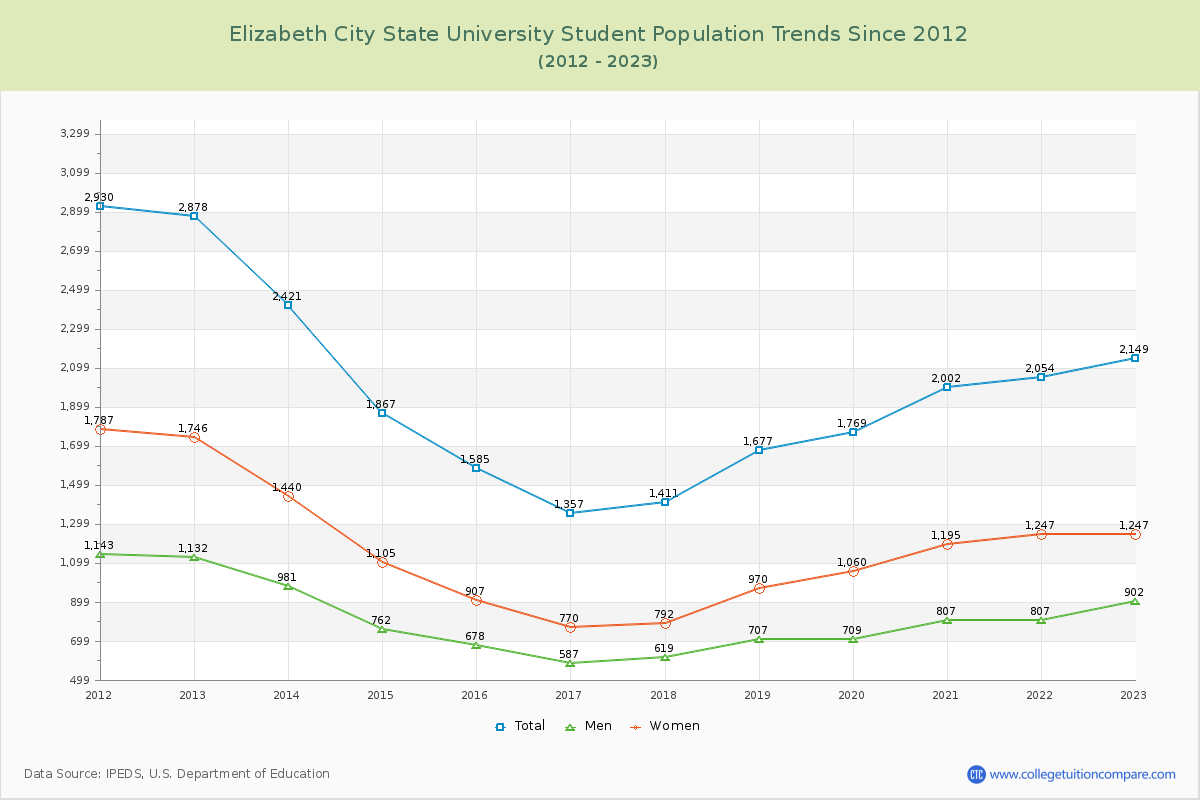
Student Population Changes
The average student population over the last 12 years is 1,925 where 2,149 students are attending the school for the academic year 2022-2023.
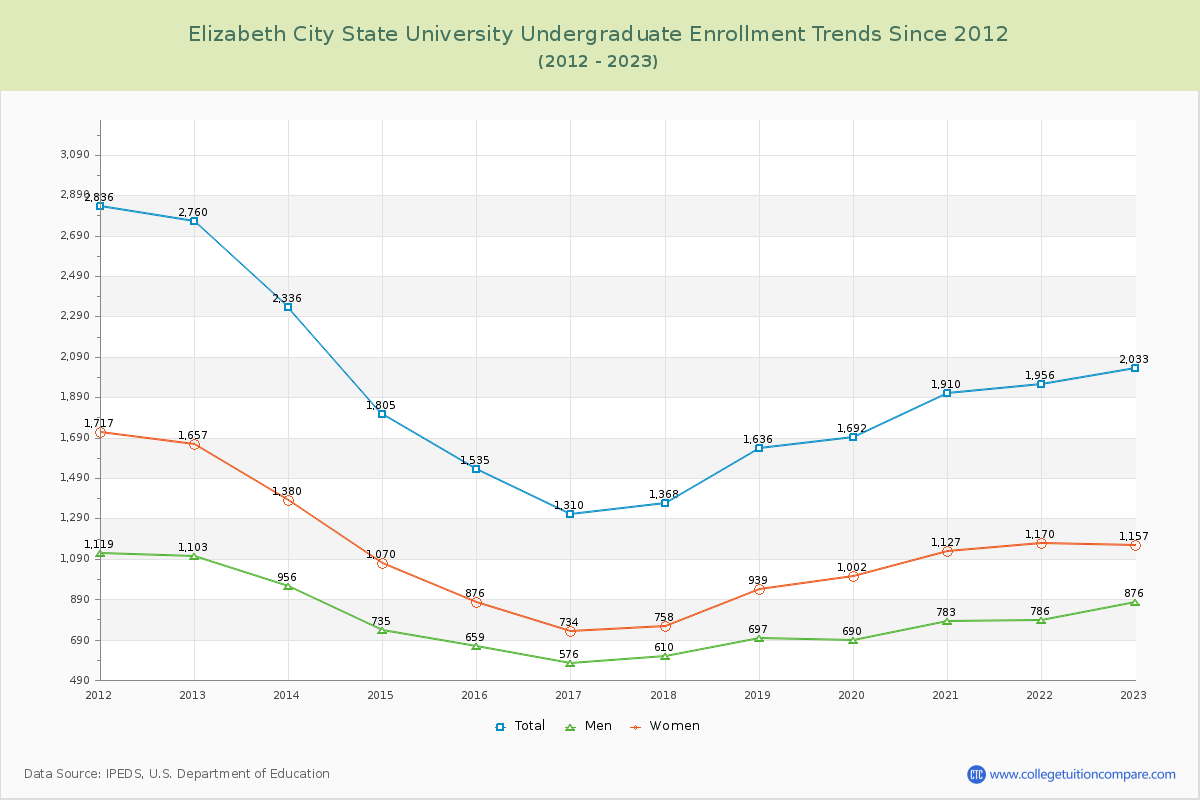
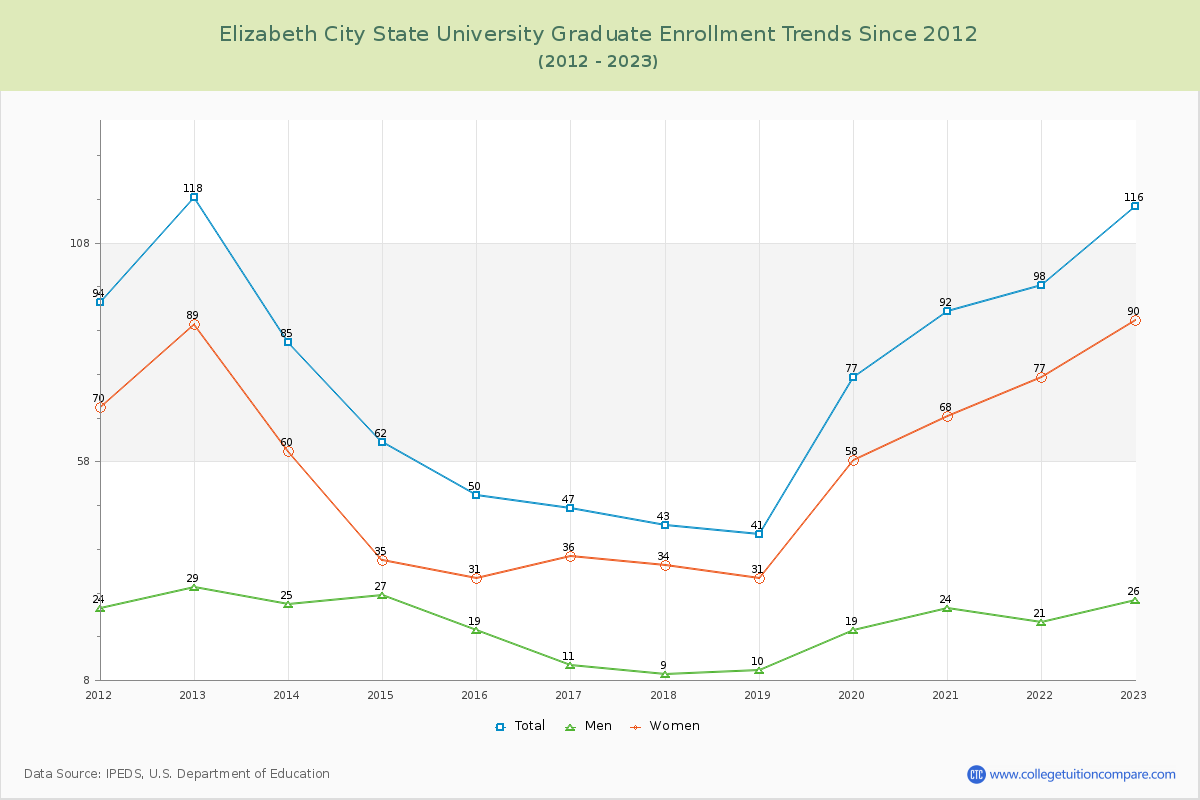
94.60% of total students is undergraduate students and 5.40% students is graduate students. The number of undergraduate students has decreased by 727 and the graduate enrollment has decreased by 2 over past 10 years.
The female to male ratio is 1.38 to 1 and it means that there are more female students enrolled in ECSU than male students.
The following table and chart illustrate the changes in student population by gender at Elizabeth City State University since 2012.
| Year | Total | Undergraduate | Graduate | ||||
|---|---|---|---|---|---|---|---|
| Total | Men | Women | Total | Men | Women | ||
| 2012-13 | 2,878 | 2,760 | 1,103 | 1,657 | 118 | 29 | 89 |
| 2013-14 | 2,421 -457 | 2,336 -424 | 956 -147 | 1,380 -277 | 85 -33 | 25 -4 | 60 -29 |
| 2014-15 | 1,867 -554 | 1,805 -531 | 735 -221 | 1,070 -310 | 62 -23 | 27 2 | 35 -25 |
| 2015-16 | 1,585 -282 | 1,535 -270 | 659 -76 | 876 -194 | 50 -12 | 19 -8 | 31 -4 |
| 2016-17 | 1,357 -228 | 1,310 -225 | 576 -83 | 734 -142 | 47 -3 | 11 -8 | 36 5 |
| 2017-18 | 1,411 54 | 1,368 58 | 610 34 | 758 24 | 43 -4 | 9 -2 | 34 -2 |
| 2018-19 | 1,677 266 | 1,636 268 | 697 87 | 939 181 | 41 -2 | 10 1 | 31 -3 |
| 2019-20 | 1,769 92 | 1,692 56 | 690 -7 | 1,002 63 | 77 36 | 19 9 | 58 27 |
| 2020-21 | 2,002 233 | 1,910 218 | 783 93 | 1,127 125 | 92 15 | 24 5 | 68 10 |
| 2021-22 | 2,054 52 | 1,956 46 | 786 3 | 1,170 43 | 98 6 | 21 -3 | 77 9 |
| 2022-23 | 2,149 95 | 2,033 77 | 876 90 | 1,157 -13 | 116 18 | 26 5 | 90 13 |
| Average | 1,925 | 1,849 | 770 | 1,079 | 75 | 20 | 55 |