Enrollment Trends at Eastern Nazarene

-945

Total Enrollment

-325

Men

-620

Women

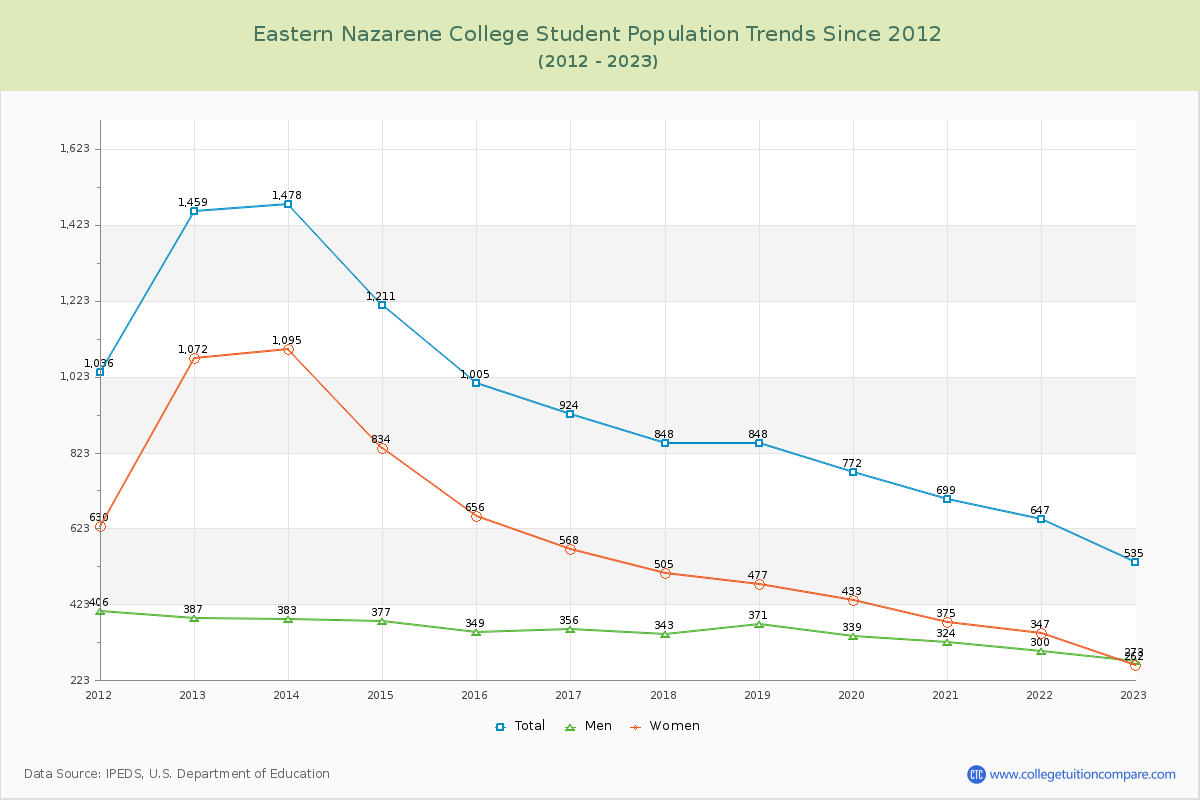
The student population at Eastern Nazarene College is 60 (23 undergraduate and 37 graduate students) . The number of students has decreased by 945 over the past decade.

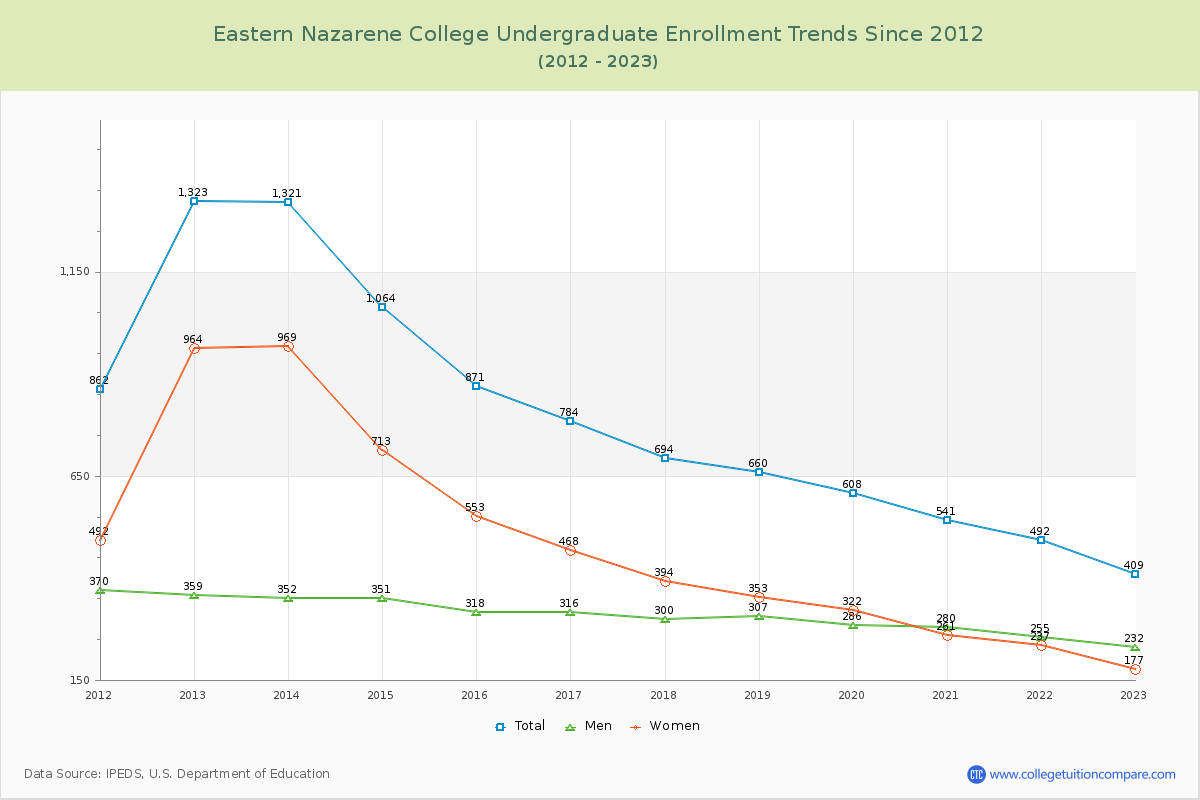
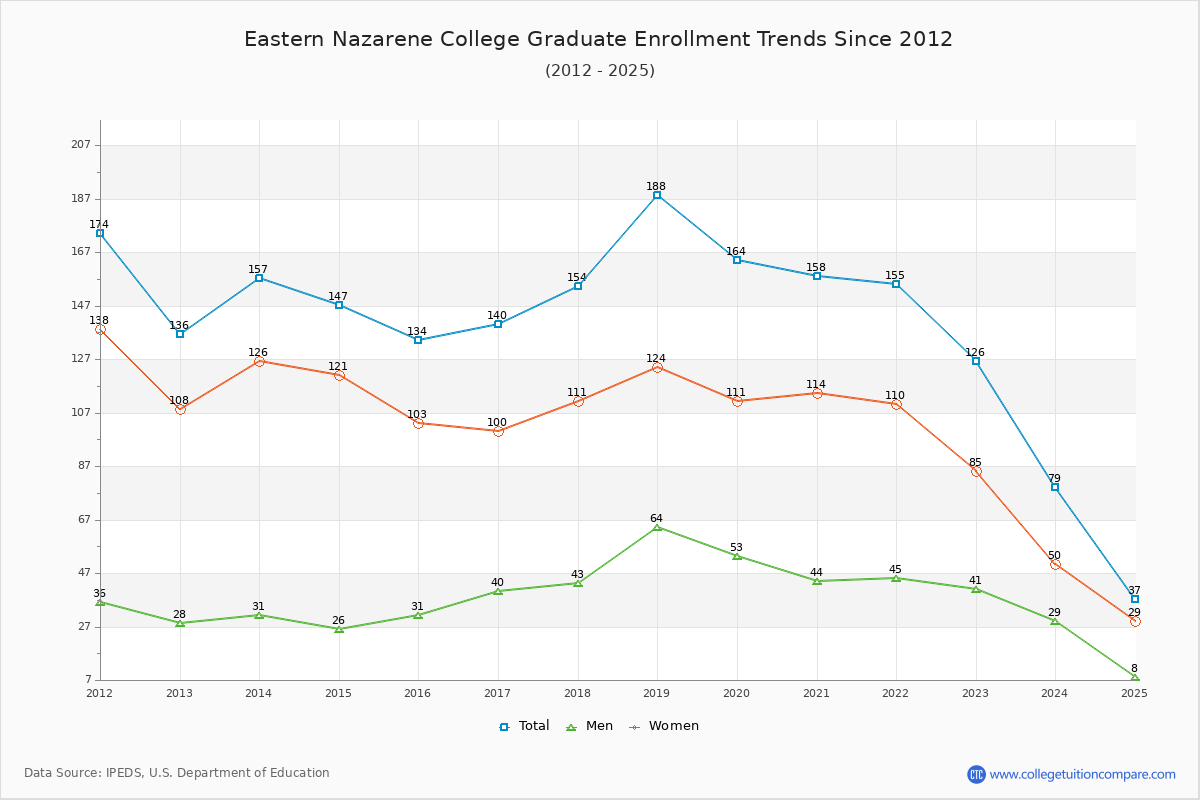
The percentage of undergraduate students at Eastern Nazarene is 38.33% which is decreased by 848 over last 10 years. The graduate student population decreased by 97 and it has been decreasing.

The female to male ratio is 1.50 to 1 which means that female students enrolled more than male students.

13 students enrolled in online degree program exclusively and the number of online students has decreased by % since 2015.

Student Population Changes

The average student population over the last 11 years is 680 where 60 students are attending the school for the academic year 2024-2025.

38.33% of total students is undergraduate students and 61.67% students is graduate students. The number of undergraduate students has decreased by 848 and the graduate enrollment has decreased by 97 over past 10 years.

The female to male ratio is 1.50 to 1 and it means that there are more female students enrolled in Eastern Nazarene than male students.

The following table and chart illustrate the changes in student population by gender at Eastern Nazarene College since 2015.

YearTotalUndergraduateGraduate
TotalMenWomenTotalMenWomen
2015-161,00587131855313431103
2016-17924
-81
784
-87
316
-2
468
-85
140
6
40
9
100
-3
2017-18848
-76
694
-90
300
-16
394
-74
154
14
43
3
111
11
2018-19848660
-34
307
7
353
-41
188
34
64
21
124
13
2019-20772
-76
608
-52
286
-21
322
-31
164
-24
53
-11
111
-13
2020-21699
-73
541
-67
280
-6
261
-61
158
-6
44
-9
114
3
2021-22647
-52
492
-49
255
-25
237
-24
155
-3
45
1
110
-4
2022-23535
-112
409
-83
232
-23
177
-60
126
-29
41
-4
85
-25
2023-24458
-77
379
-30
215
-17
164
-13
79
-47
29
-12
50
-35
2024-2560
-398
23
-356
16
-199
7
-157
37
-42
8
-21
29
-21
Average6805462532941344094
Eastern Nazarene College Enrollment Trends Chart

Undergraduate Enrollment Changes

The average number of Undergraduate students over the last 11 years is 546 where 23 students are attending the Undergraduate school for the academic year 2024-2025. The following table and chart illustrate the changes in Undergraduate enrollment by attending status and gender at Eastern Nazarene College since 2015.

YearTotalFull-timePart-time
TotalMenWomenTotalMenWomen
2015-1687163625438223564171
2016-177846562863701283098
2017-186945712593121234182
2018-19660578284294822359
2019-20608550269281581741
2020-21541512266246291415
2021-22492450236214421923
2022-23409381222159281018
2023-2437935920715220812
2024-252317125642
Average5465462302425462352
Eastern Nazarene College Undergraduate Enrollment Trends Chart

Graduate Enrollment Changes

The average number of Graduate students over the last 11 years is 134 where 37 students are attending the Graduate school for the academic year 2024-2025. The following table and chart illustrate the changes in Graduate enrollment by attending status and gender at Eastern Nazarene College since 2015.

YearTotalMenWomen
2015-16134591346751857
2016-17140601941802159
2017-18154882662661749
2018-19188992772893752
2019-20164973661671750
2020-21158872859711655
2021-22155913259641351
2022-23126661848602337
2023-247951203128919
2024-253737829000
Average13413423511341743
Eastern Nazarene College Graduate Enrollment Trends Chart

Enrollment by Race/Ethnicity Changes

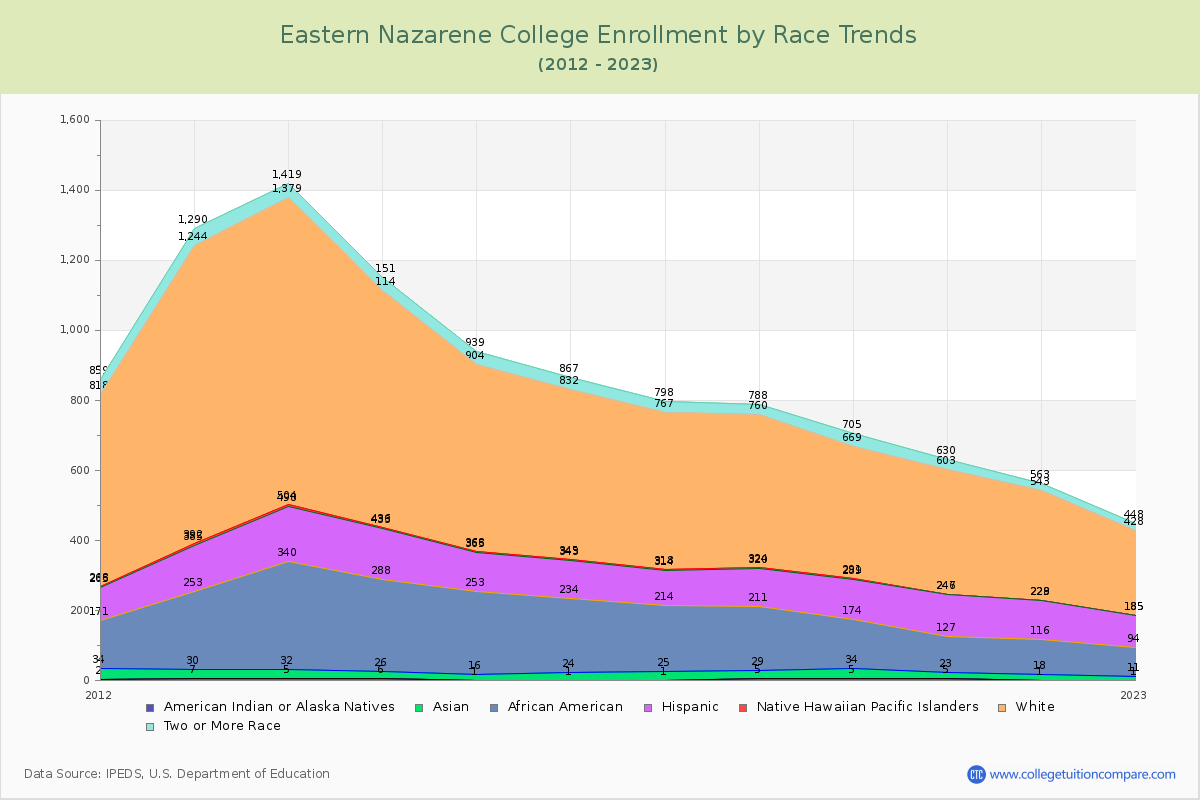
The percentage of white students is 58.33%. The percentage was 53.33% 10 years ago and Eastern Nazarene still has a high percentage of white students. 6.67% of enrolled students is Asian and 21.67% is black students. Hispanic students comprise 5.00% of the student body.

Over the past 10 years, the racial composition has shifted. The percentage of white students increased from 53.33% to 58.33%. Asian enrollment grew from 1.49% to 6.67%. Black student enrollment decreased from 23.58% to 21.67%. Hispanic student representation contracted from 11.14% to 5.00%.

The overall racial diversity, measured by the Census Bureau Diversity Index, is 0.6058 which indicates that moderately diverse. This decreased from 0.6461 a decade ago, suggesting that racial diversity has declined.

The following table and chart illustrate the student population trends by race/ethnicity at Eastern Nazarene College over the past 11 years (2015-2025).

YearAmerican Indian or Native AmericanAsianBlackHispanicNative Hawaiian or Other Pacific IslanderWhiteTwo or More Races
2015-16115237112353635
2016-17123210109248735
2017-18124189100444931
2018-19524182109443628
2019-20529140115237836
2020-21518104119135627
2021-2211798112131420
2022-231108391024320
2023-24196597117826
2024-25041330350
Average21713297234126
Eastern Nazarene College Enrollment by Race Trends Chart

Distance Learning (Online Courses) Enrollment Changes

13 students are enrolled in online degree programs exclusively for the academic year 2024-2025, which is 22% of total students. The number of online students has decreased % since 2015. The following table and chart illustrate the changes in the online student population by enrolled type at Eastern Nazarene College from 2015 to 2025.

YearTotal EnrollmentOnline CompletelyEnrolled in Some Online CoursesNot Enrolled in Online Courses
2015-161,005001,005
2016-1792400924
2017-1884800848
2018-1984800848
2019-207720104668
2020-21699159156384
2021-2264759125463
2022-2353531179325
2023-2445814155289
2024-2560131631
Average6802874579

Ratings & Review

Share your experiences and thoughts about Eastern Nazarene College. It will be a great help to applicants and prospective students!