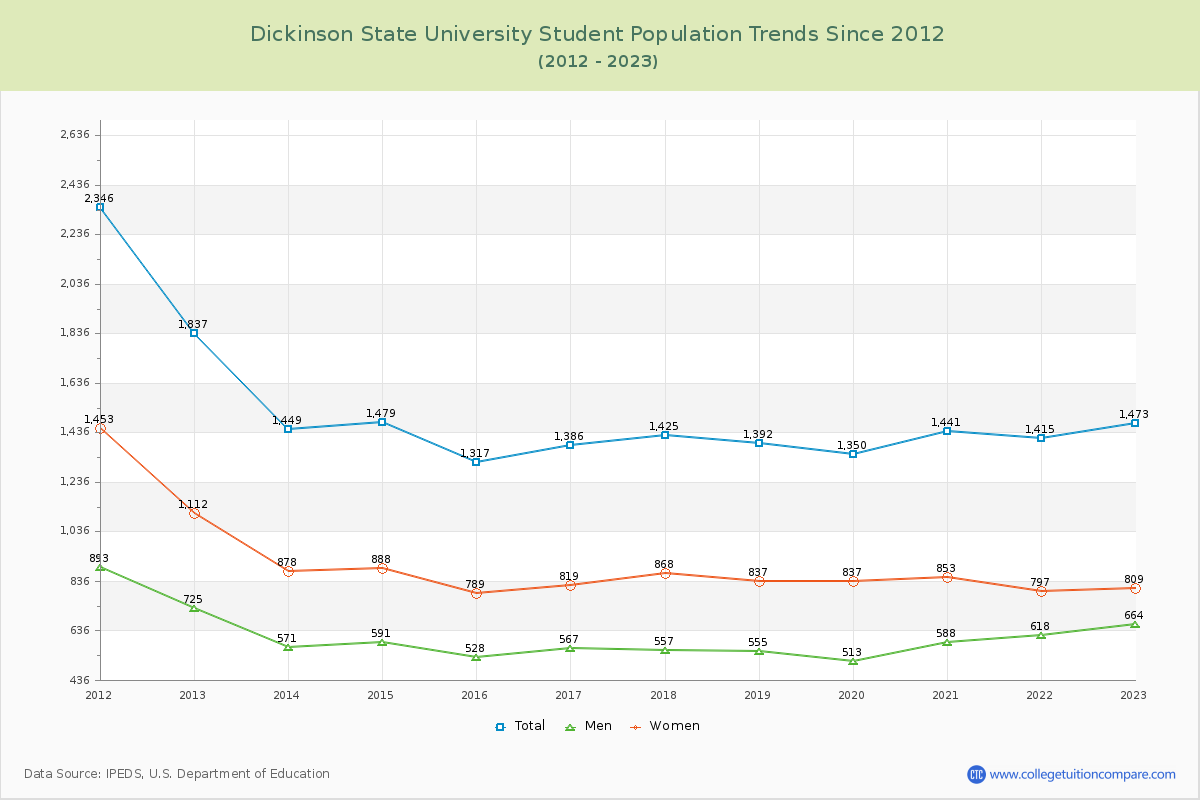
Student Population Changes
The average student population over the last 12 years is 1,451 where 1,473 students are attending the school for the academic year 2022-2023.
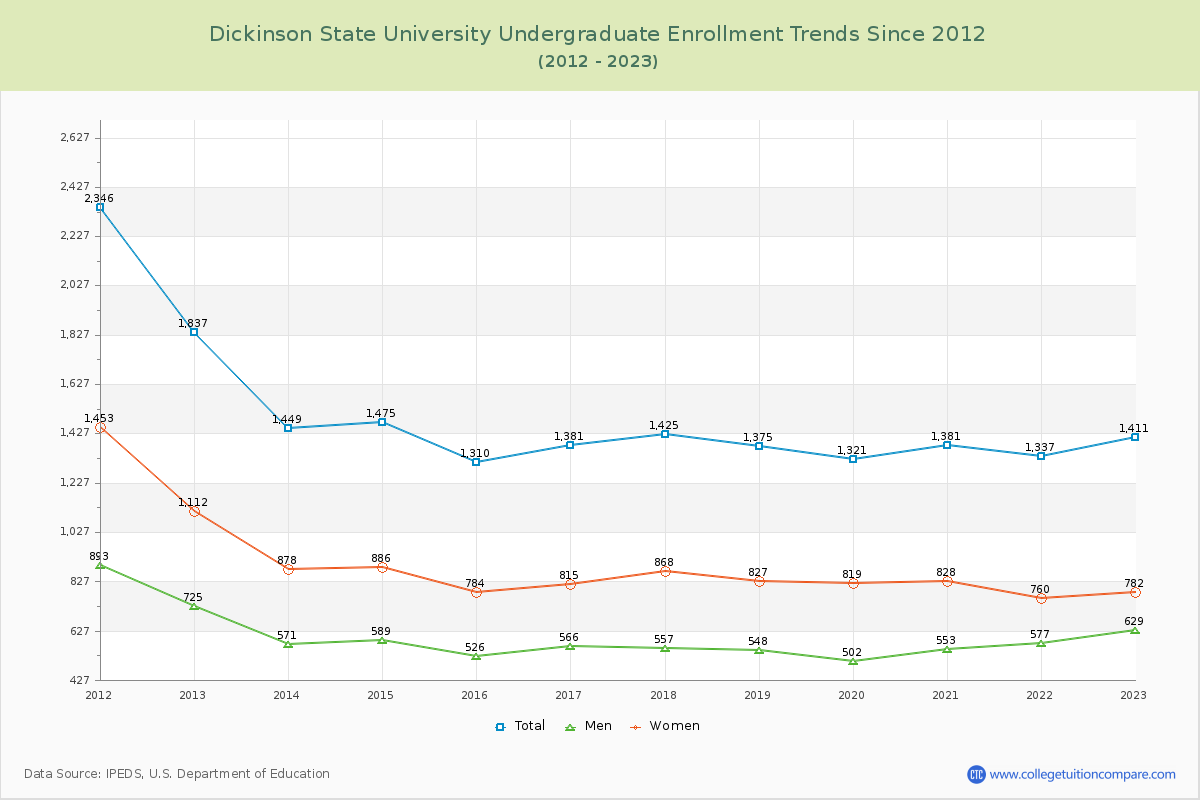
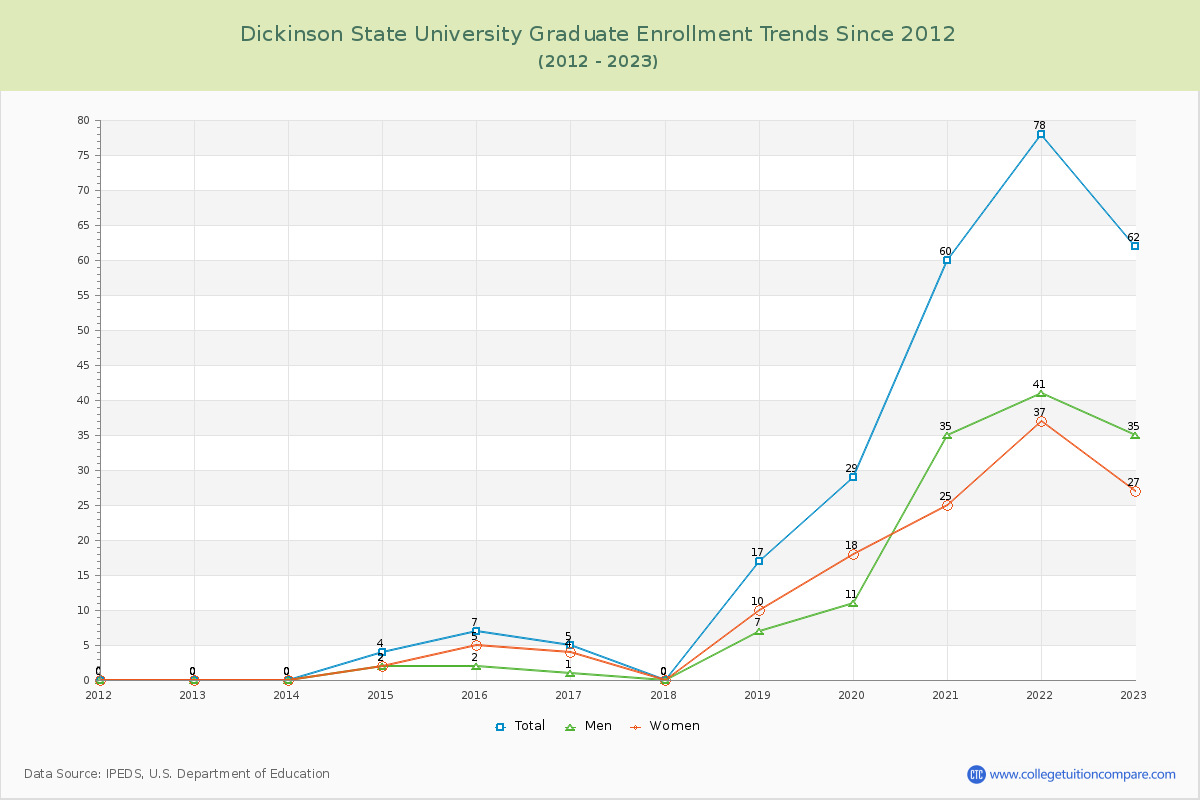
95.79% of total students is undergraduate students and 4.21% students is graduate students. The number of undergraduate students has decreased by 426 and the graduate enrollment has increased by 62 over past 10 years.
The female to male ratio is 1.22 to 1 and it means that there are slightly more female students enrolled in DSU than male students.
The following table and chart illustrate the changes in student population by gender at Dickinson State University since 2012.
| Year | Total | Undergraduate | Graduate | ||||
|---|---|---|---|---|---|---|---|
| Total | Men | Women | Total | Men | Women | ||
| 2012-13 | 1,837 | 1,837 | 725 | 1,112 | 0 | 0 | 0 |
| 2013-14 | 1,449 -388 | 1,449 -388 | 571 -154 | 878 -234 | 0 0 | 0 0 | 0 0 |
| 2014-15 | 1,479 30 | 1,475 26 | 589 18 | 886 8 | 4 4 | 2 2 | 2 2 |
| 2015-16 | 1,317 -162 | 1,310 -165 | 526 -63 | 784 -102 | 7 3 | 2 0 | 5 3 |
| 2016-17 | 1,386 69 | 1,381 71 | 566 40 | 815 31 | 5 -2 | 1 -1 | 4 -1 |
| 2017-18 | 1,425 39 | 1,425 44 | 557 -9 | 868 53 | 0 -5 | 0 -1 | 0 -4 |
| 2018-19 | 1,392 -33 | 1,375 -50 | 548 -9 | 827 -41 | 17 17 | 7 7 | 10 10 |
| 2019-20 | 1,350 -42 | 1,321 -54 | 502 -46 | 819 -8 | 29 12 | 11 4 | 18 8 |
| 2020-21 | 1,441 91 | 1,381 60 | 553 51 | 828 9 | 60 31 | 35 24 | 25 7 |
| 2021-22 | 1,415 -26 | 1,337 -44 | 577 24 | 760 -68 | 78 18 | 41 6 | 37 12 |
| 2022-23 | 1,473 58 | 1,411 74 | 629 52 | 782 22 | 62 -16 | 35 -6 | 27 -10 |
| Average | 1,451 | 1,427 | 577 | 851 | 24 | 12 | 12 |