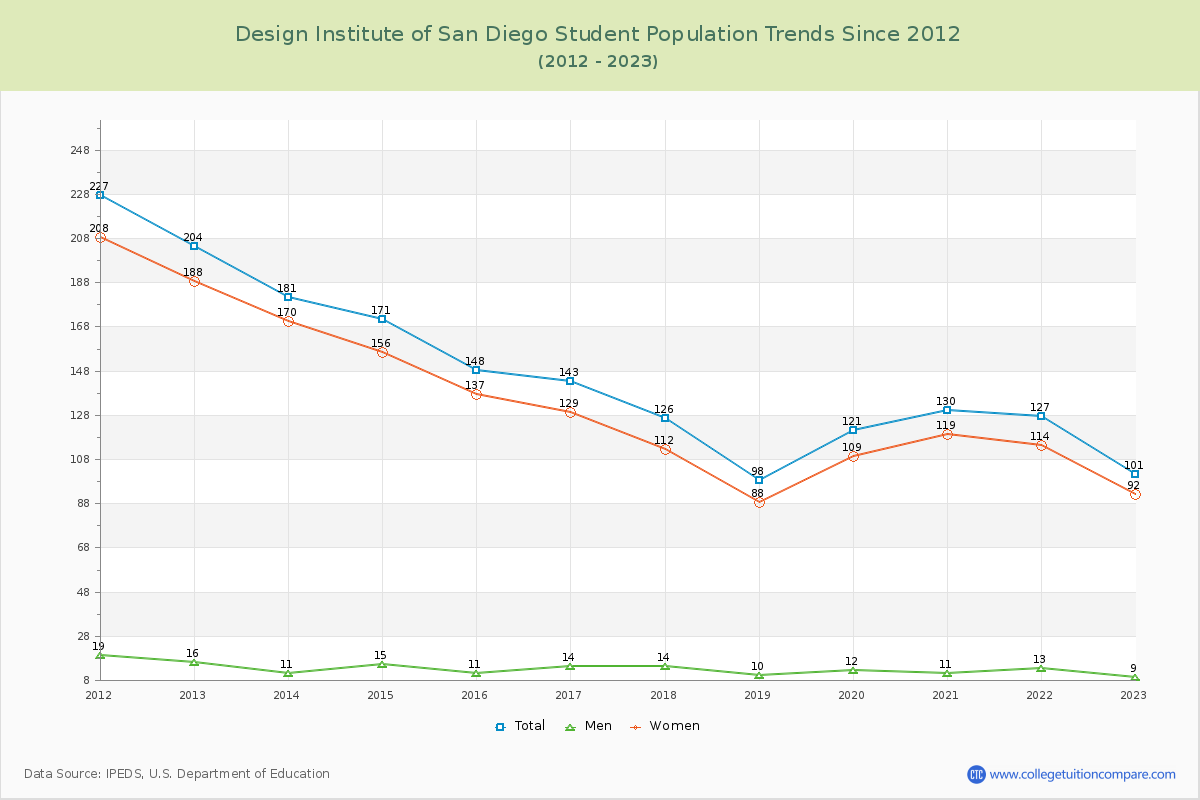
Student Population Changes
The average student population over the last 12 years is 141 where 101 students are attending the school for the academic year 2022-2023.
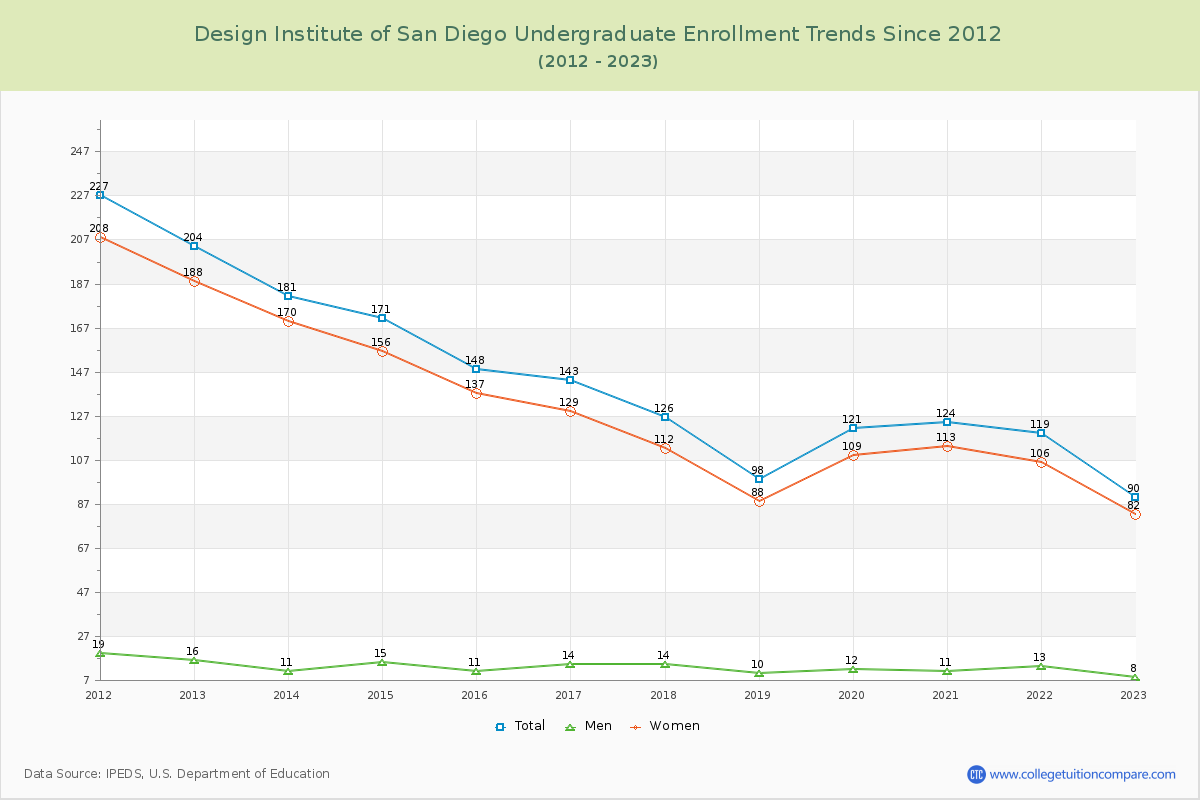
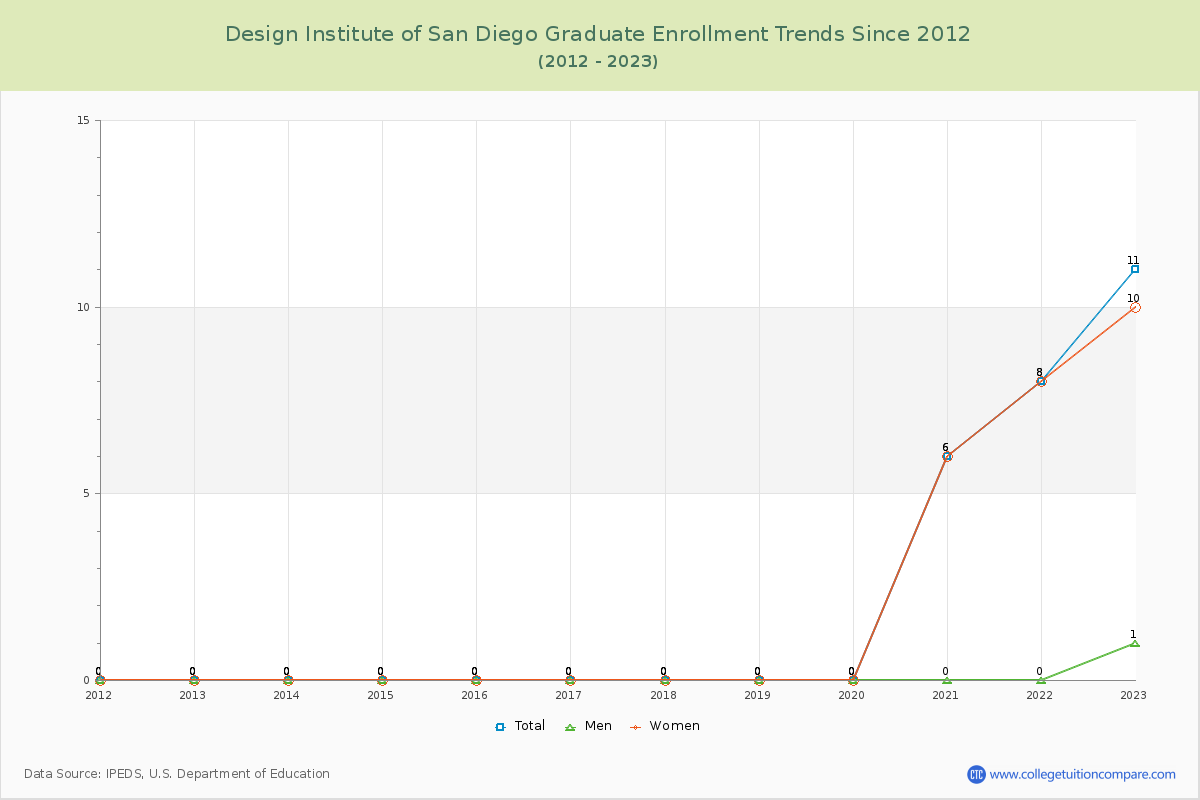
89.11% of total students is undergraduate students and 10.89% students is graduate students. The number of undergraduate students has decreased by 114 and the graduate enrollment has increased by 11 over past 10 years.
The female to male ratio is 10.22 to 1 and it means that there are far more female students enrolled in Design Institute of San Diego than male students.
The following table and chart illustrate the changes in student population by gender at Design Institute of San Diego since 2012.
| Year | Total | Undergraduate | Graduate | ||||
|---|---|---|---|---|---|---|---|
| Total | Men | Women | Total | Men | Women | ||
| 2012-13 | 204 | 204 | 16 | 188 | 0 | 0 | 0 |
| 2013-14 | 181 -23 | 181 -23 | 11 -5 | 170 -18 | 0 0 | 0 0 | 0 0 |
| 2014-15 | 171 -10 | 171 -10 | 15 4 | 156 -14 | 0 0 | 0 0 | 0 0 |
| 2015-16 | 148 -23 | 148 -23 | 11 -4 | 137 -19 | 0 0 | 0 0 | 0 0 |
| 2016-17 | 143 -5 | 143 -5 | 14 3 | 129 -8 | 0 0 | 0 0 | 0 0 |
| 2017-18 | 126 -17 | 126 -17 | 14 0 | 112 -17 | 0 0 | 0 0 | 0 0 |
| 2018-19 | 98 -28 | 98 -28 | 10 -4 | 88 -24 | 0 0 | 0 0 | 0 0 |
| 2019-20 | 121 23 | 121 23 | 12 2 | 109 21 | 0 0 | 0 0 | 0 0 |
| 2020-21 | 130 9 | 124 3 | 11 -1 | 113 4 | 6 6 | 0 0 | 6 6 |
| 2021-22 | 127 -3 | 119 -5 | 13 2 | 106 -7 | 8 2 | 0 0 | 8 2 |
| 2022-23 | 101 -26 | 90 -29 | 8 -5 | 82 -24 | 11 3 | 1 1 | 10 2 |
| Average | 141 | 139 | 12 | 126 | 2 | 0 | 2 |