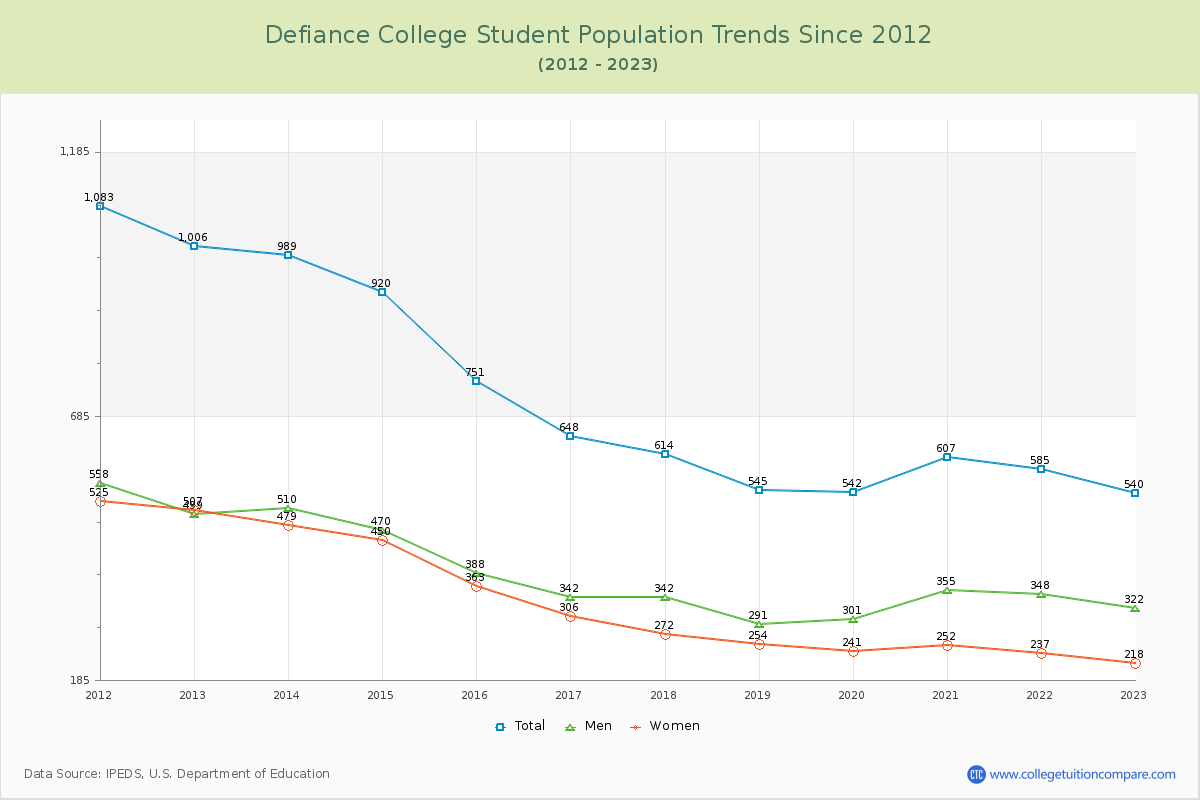
Student Population Changes
The average student population over the last 12 years is 704 where 540 students are attending the school for the academic year 2022-2023.
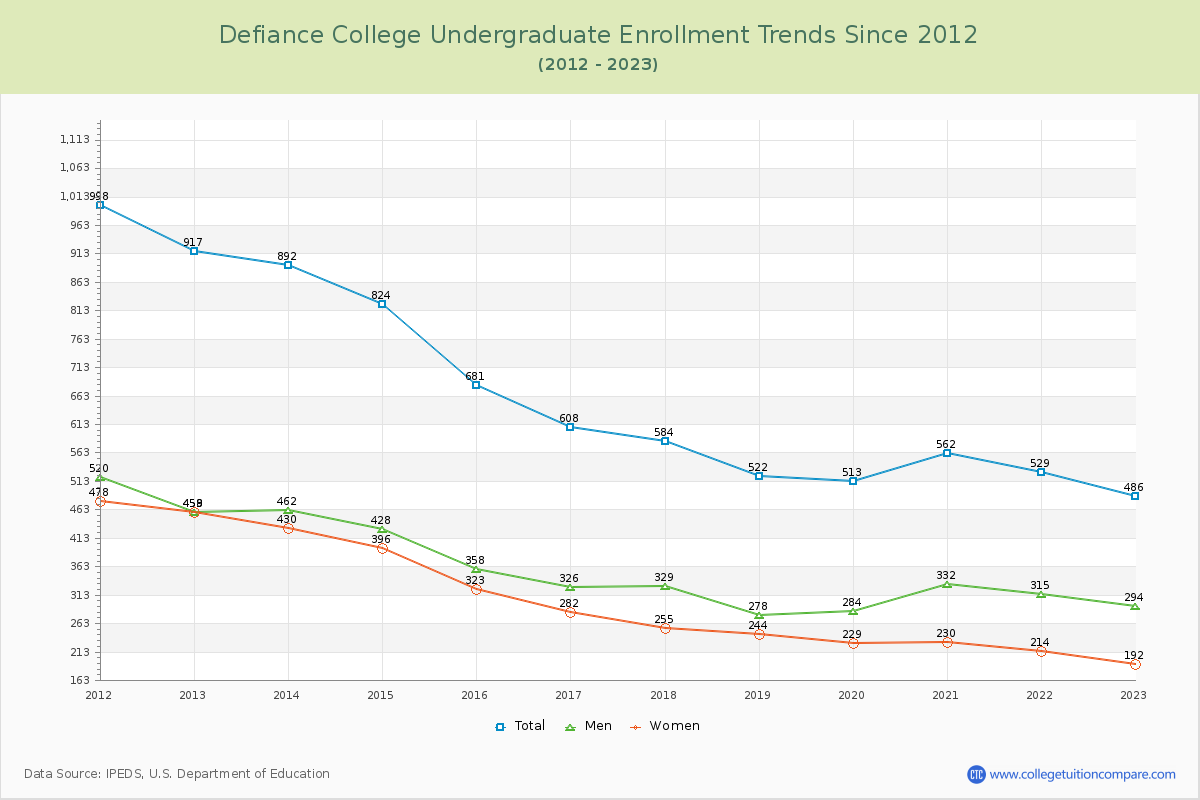
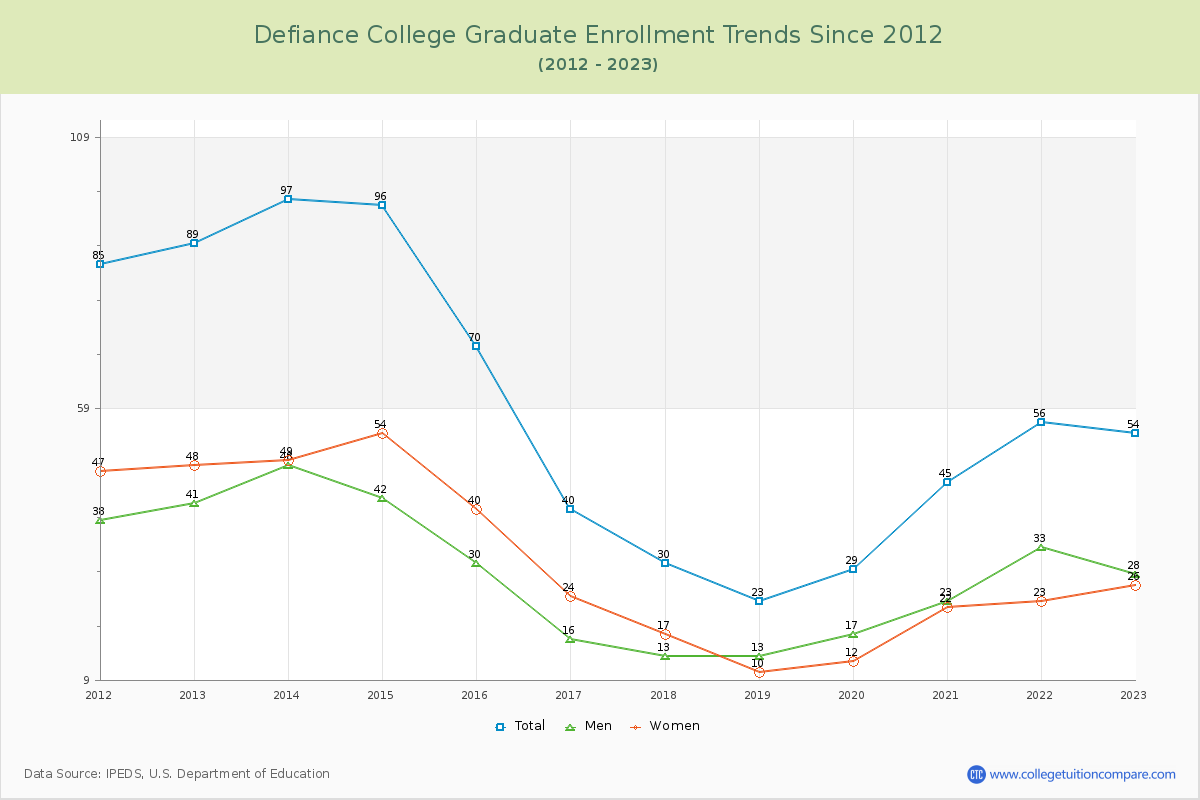
90.00% of total students is undergraduate students and 10.00% students is graduate students. The number of undergraduate students has decreased by 431 and the graduate enrollment has decreased by 35 over past 10 years.
The female to male ratio is 0.68 to 1 and it means that there are more male students enrolled in Defiance than female students.
The following table and chart illustrate the changes in student population by gender at Defiance College since 2012.
| Year | Total | Undergraduate | Graduate | ||||
|---|---|---|---|---|---|---|---|
| Total | Men | Women | Total | Men | Women | ||
| 2012-13 | 1,006 | 917 | 458 | 459 | 89 | 41 | 48 |
| 2013-14 | 989 -17 | 892 -25 | 462 4 | 430 -29 | 97 8 | 48 7 | 49 1 |
| 2014-15 | 920 -69 | 824 -68 | 428 -34 | 396 -34 | 96 -1 | 42 -6 | 54 5 |
| 2015-16 | 751 -169 | 681 -143 | 358 -70 | 323 -73 | 70 -26 | 30 -12 | 40 -14 |
| 2016-17 | 648 -103 | 608 -73 | 326 -32 | 282 -41 | 40 -30 | 16 -14 | 24 -16 |
| 2017-18 | 614 -34 | 584 -24 | 329 3 | 255 -27 | 30 -10 | 13 -3 | 17 -7 |
| 2018-19 | 545 -69 | 522 -62 | 278 -51 | 244 -11 | 23 -7 | 13 0 | 10 -7 |
| 2019-20 | 542 -3 | 513 -9 | 284 6 | 229 -15 | 29 6 | 17 4 | 12 2 |
| 2020-21 | 607 65 | 562 49 | 332 48 | 230 1 | 45 16 | 23 6 | 22 10 |
| 2021-22 | 585 -22 | 529 -33 | 315 -17 | 214 -16 | 56 11 | 33 10 | 23 1 |
| 2022-23 | 540 -45 | 486 -43 | 294 -21 | 192 -22 | 54 -2 | 28 -5 | 26 3 |
| Average | 704 | 647 | 351 | 296 | 57 | 28 | 30 |