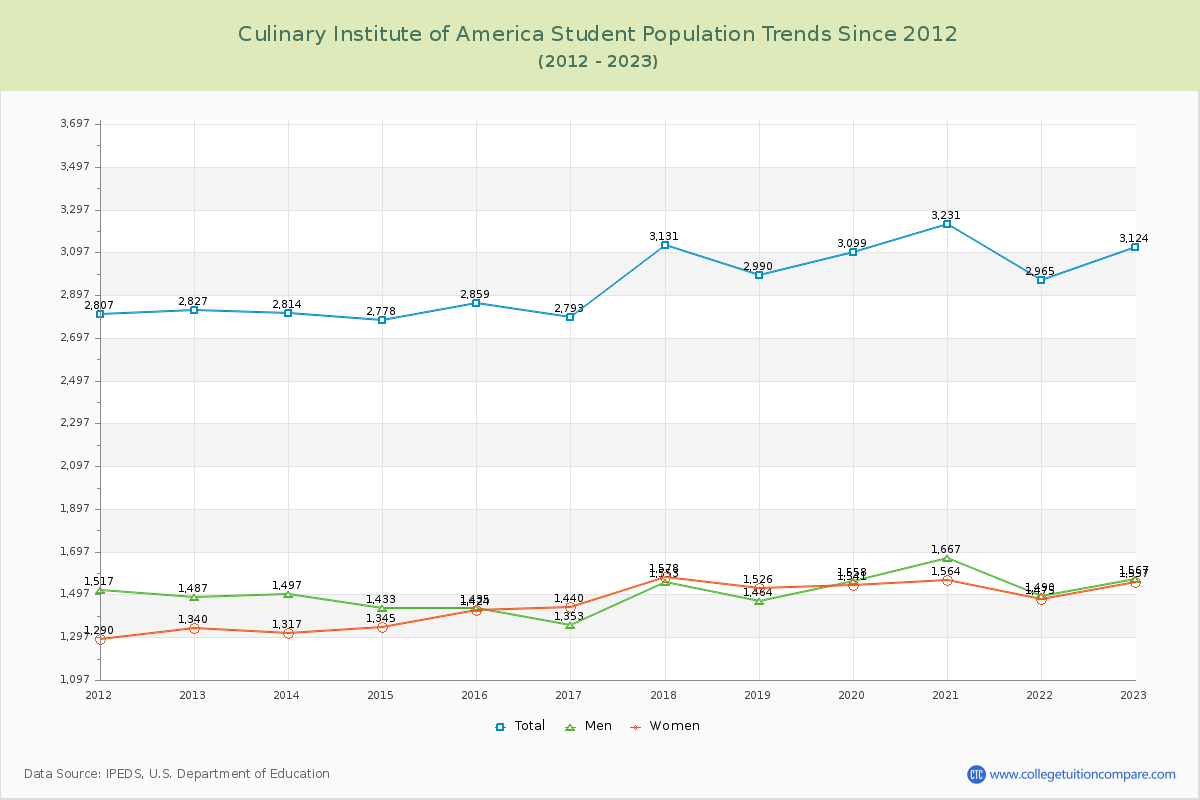
Student Population Changes
The average student population over the last 12 years is 2,965 where 3,124 students are attending the school for the academic year 2022-2023.
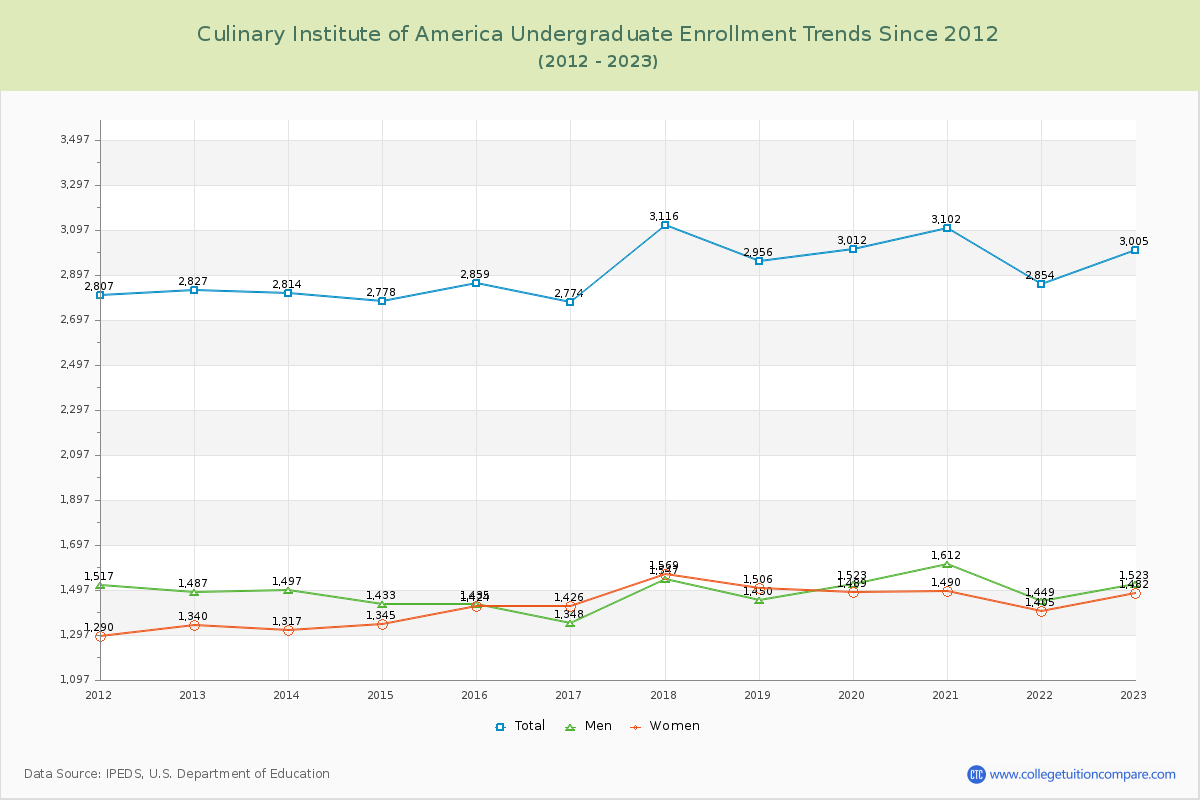
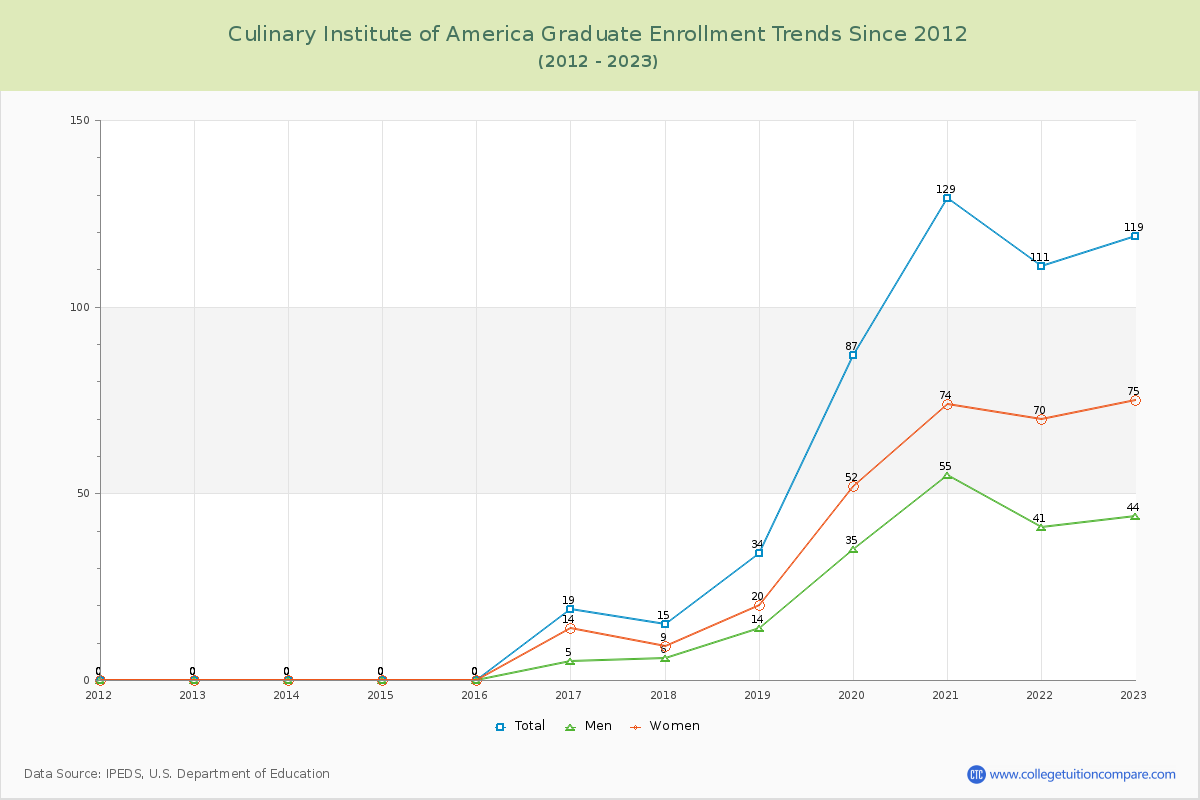
96.19% of total students is undergraduate students and 3.81% students is graduate students. The number of undergraduate students has increased by 178 and the graduate enrollment has increased by 119 over past 10 years.
The female to male ratio is 0.99 to 1 and it means that there are similar numbers of female and male students enrolled in CIA.
The following table and chart illustrate the changes in student population by gender at Culinary Institute of America since 2012.
| Year | Total | Undergraduate | Graduate | ||||
|---|---|---|---|---|---|---|---|
| Total | Men | Women | Total | Men | Women | ||
| 2012-13 | 2,827 | 2,827 | 1,487 | 1,340 | 0 | 0 | 0 |
| 2013-14 | 2,814 -13 | 2,814 -13 | 1,497 10 | 1,317 -23 | 0 0 | 0 0 | 0 0 |
| 2014-15 | 2,778 -36 | 2,778 -36 | 1,433 -64 | 1,345 28 | 0 0 | 0 0 | 0 0 |
| 2015-16 | 2,859 81 | 2,859 81 | 1,435 2 | 1,424 79 | 0 0 | 0 0 | 0 0 |
| 2016-17 | 2,793 -66 | 2,774 -85 | 1,348 -87 | 1,426 2 | 19 19 | 5 5 | 14 14 |
| 2017-18 | 3,131 338 | 3,116 342 | 1,547 199 | 1,569 143 | 15 -4 | 6 1 | 9 -5 |
| 2018-19 | 2,990 -141 | 2,956 -160 | 1,450 -97 | 1,506 -63 | 34 19 | 14 8 | 20 11 |
| 2019-20 | 3,099 109 | 3,012 56 | 1,523 73 | 1,489 -17 | 87 53 | 35 21 | 52 32 |
| 2020-21 | 3,231 132 | 3,102 90 | 1,612 89 | 1,490 1 | 129 42 | 55 20 | 74 22 |
| 2021-22 | 2,965 -266 | 2,854 -248 | 1,449 -163 | 1,405 -85 | 111 -18 | 41 -14 | 70 -4 |
| 2022-23 | 3,124 159 | 3,005 151 | 1,523 74 | 1,482 77 | 119 8 | 44 3 | 75 5 |
| Average | 2,965 | 2,918 | 1,482 | 1,436 | 47 | 18 | 29 |