Student Population by Gender
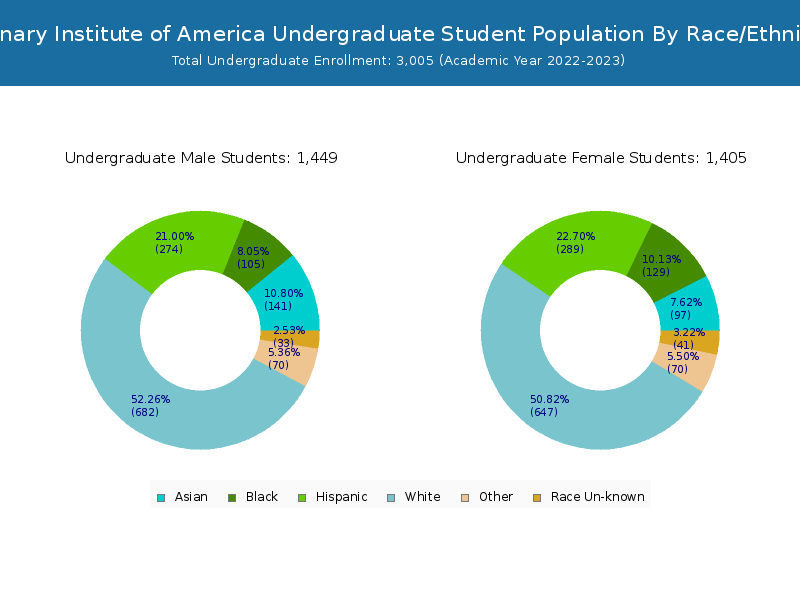
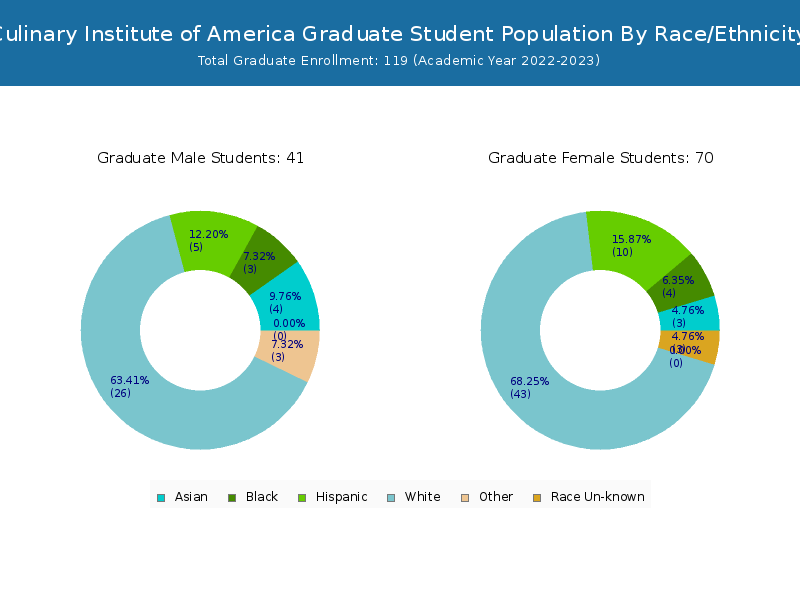
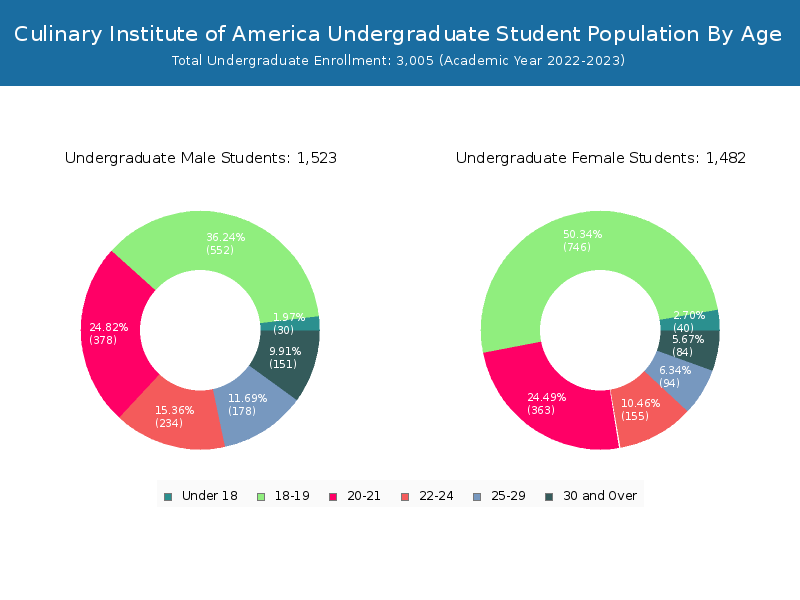
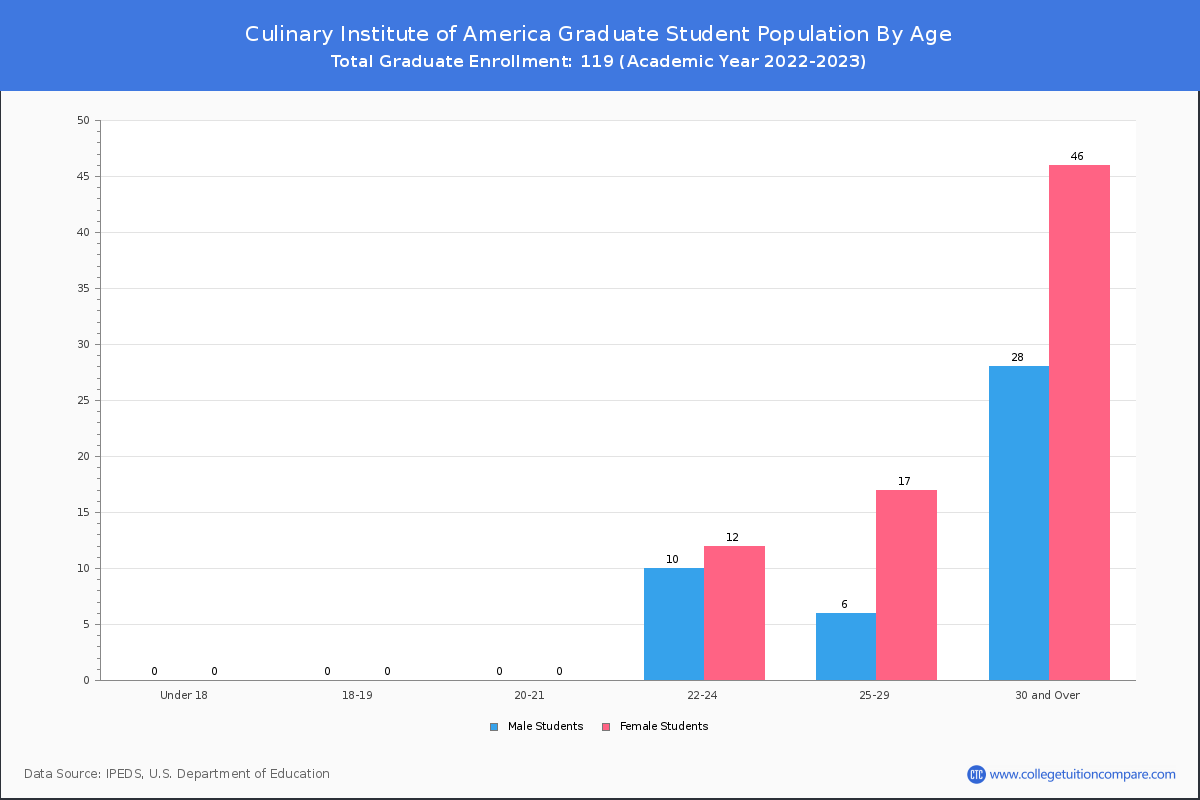
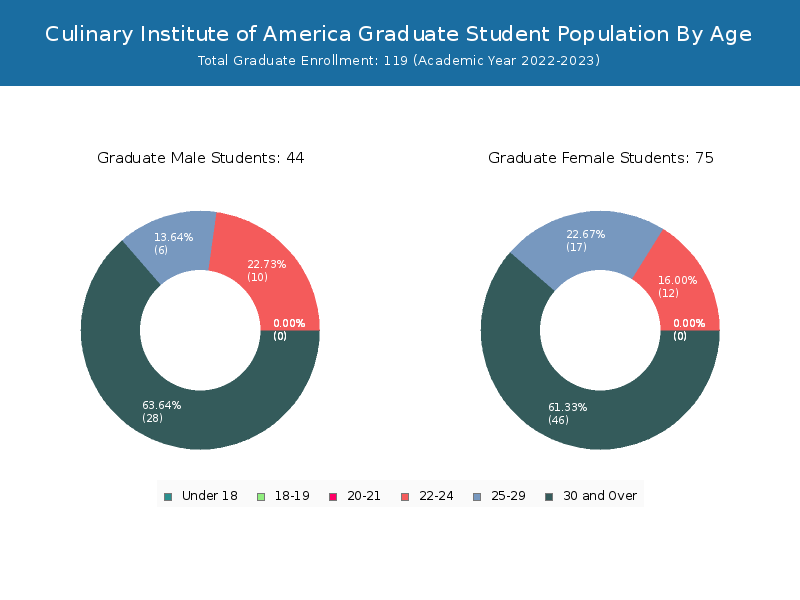
Culinary Institute of America has a total of 3,124 enrolled students for the academic year 2022-2023. 3,005 students have enrolled in undergraduate programs and 119 students joined graduate programs.
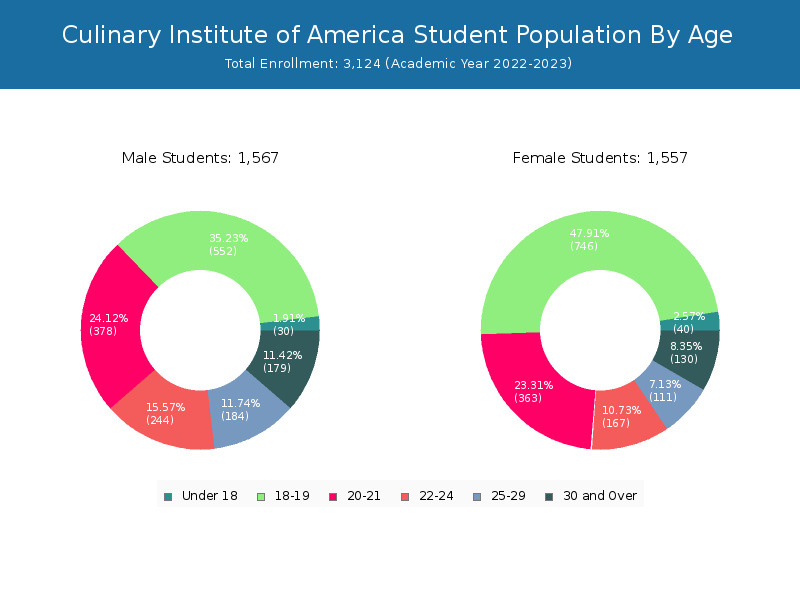
By gender, 1,567 male and 1,557 female students (the male-female ratio is 50:50) are attending the school. The gender distribution is based on the 2022-2023 data.
| Total | Undergraduate | Graduate | |
|---|---|---|---|
| Total | 3,124 | 3,005 | 119 |
| Men | 1,567 | 1,523 | 44 |
| Women | 1,557 | 1,482 | 75 |
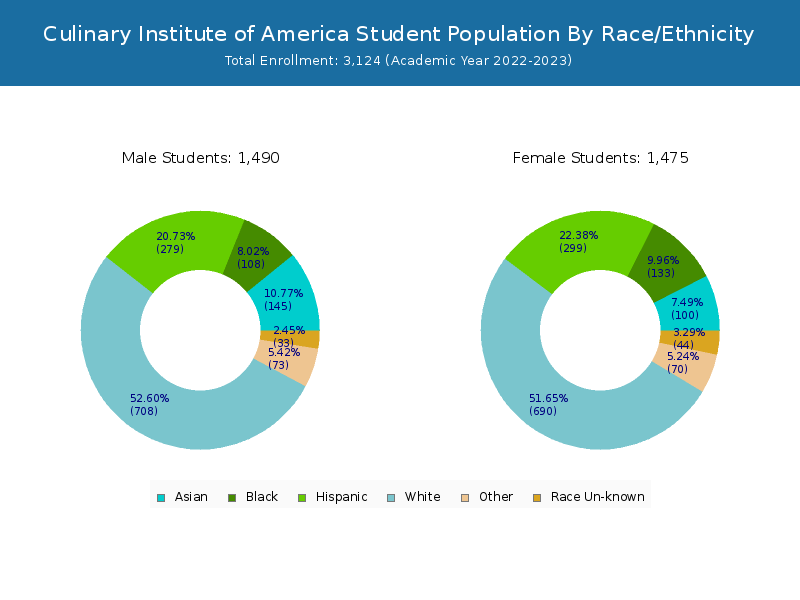
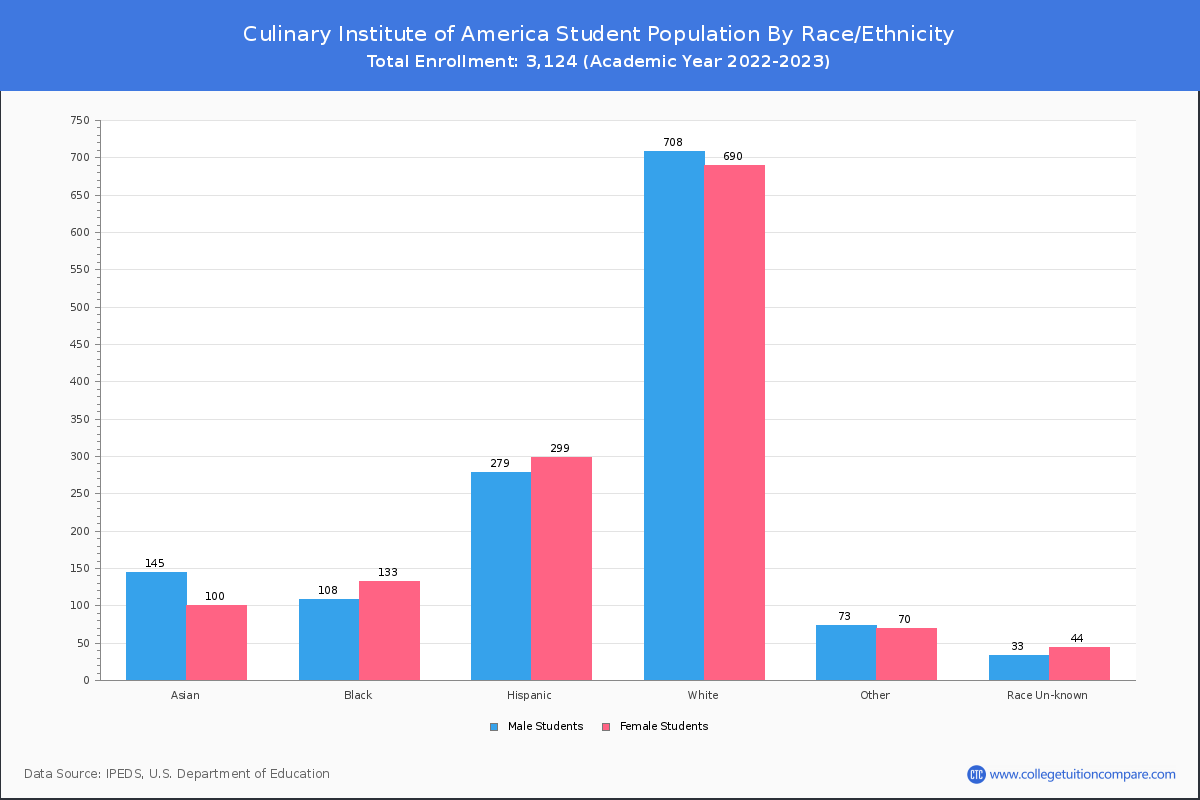
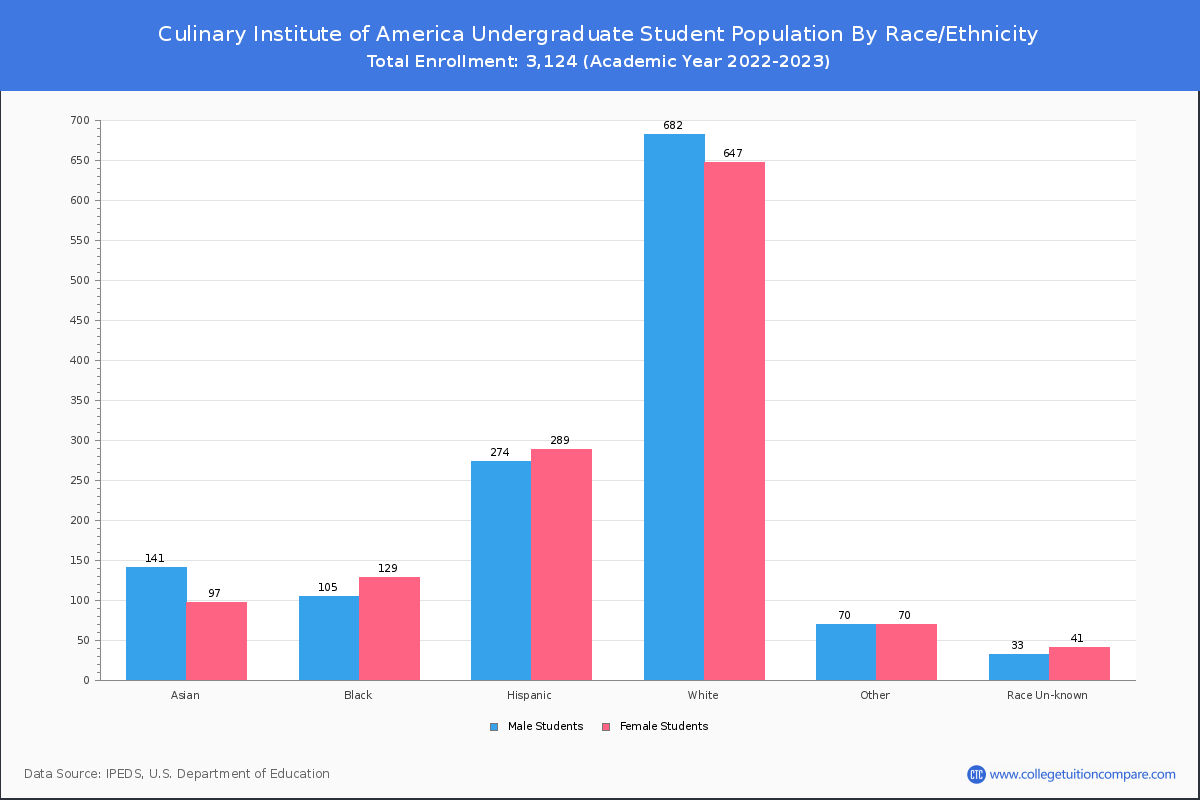
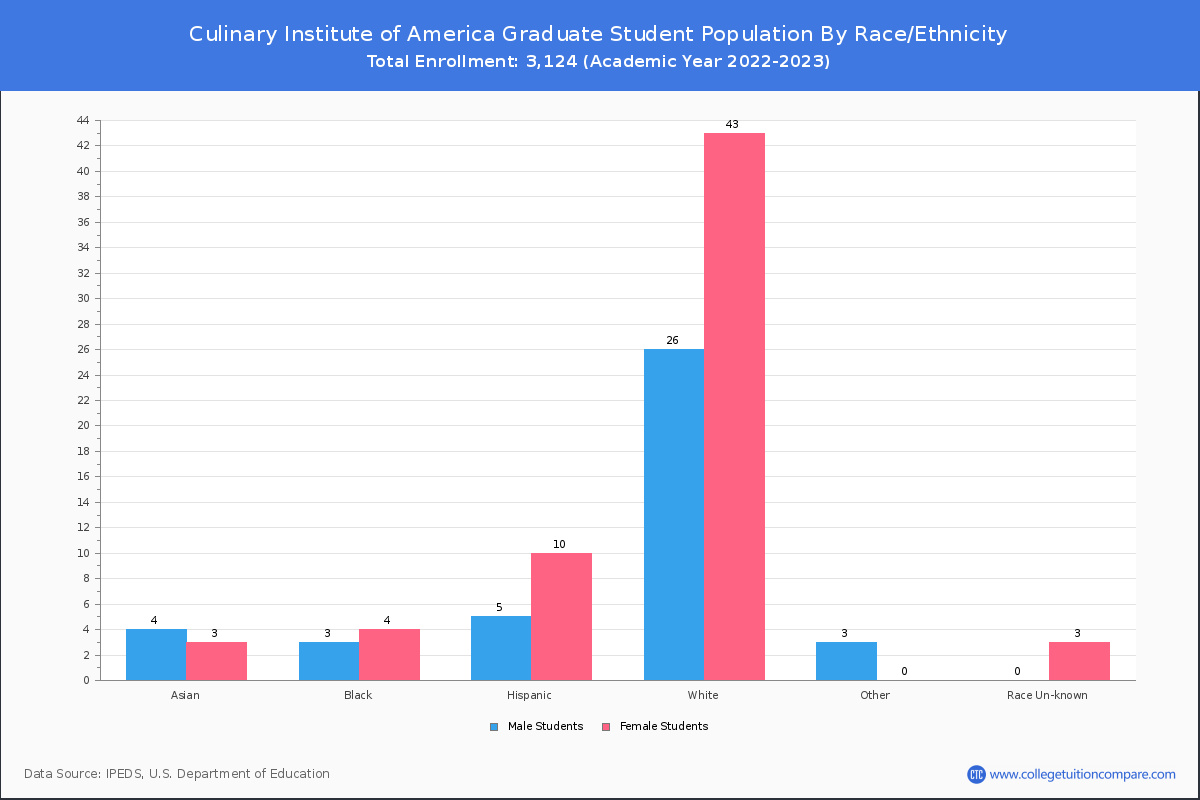
Student Distribution by Race/Ethnicity
By race/ethnicity, 1,455 White, 222 Black, and 262 Asian students out of a total of 3,124 are attending at Culinary Institute of America. Comprehensive enrollment statistic data by race/ethnicity is shown in the next chart (Academic year 2022-2023 data).
| Race | Total | Men | Women |
|---|---|---|---|
| American Indian or Native American | 13 | 5 | 8 |
| Asian | 262 | 149 | 113 |
| Black | 222 | 91 | 131 |
| Hispanic | 595 | 281 | 314 |
| Native Hawaiian or Other Pacific Islanders | 10 | 6 | 4 |
| White | 1,455 | 742 | 713 |
| Two or more races | 153 | 73 | 80 |
| Race Unknown | 81 | 48 | 33 |
| Race | Total | Men | Women |
|---|---|---|---|
| American Indian or Native American | 13 | 5 | 8 |
| Asian | 252 | 145 | 107 |
| Black | 213 | 87 | 126 |
| Hispanic | 584 | 275 | 309 |
| Native Hawaiian or Other Pacific Islanders | 10 | 6 | 4 |
| White | 1,385 | 717 | 668 |
| Two or more races | 149 | 72 | 77 |
| Race Unknown | 73 | 44 | 29 |
| Race | Total | Men | Women |
|---|---|---|---|
| American Indian or Native American | 3 | 2 | 1 |
| Asian | 30 | 14 | 16 |
| Black | 24 | 8 | 16 |
| Hispanic | 74 | 40 | 34 |
| Native Hawaiian or Other Pacific Islanders | 0 | 0 | 0 |
| White | 244 | 118 | 126 |
| Two or more races | 18 | 12 | 6 |
| Race Unknown | 13 | 9 | 4 |
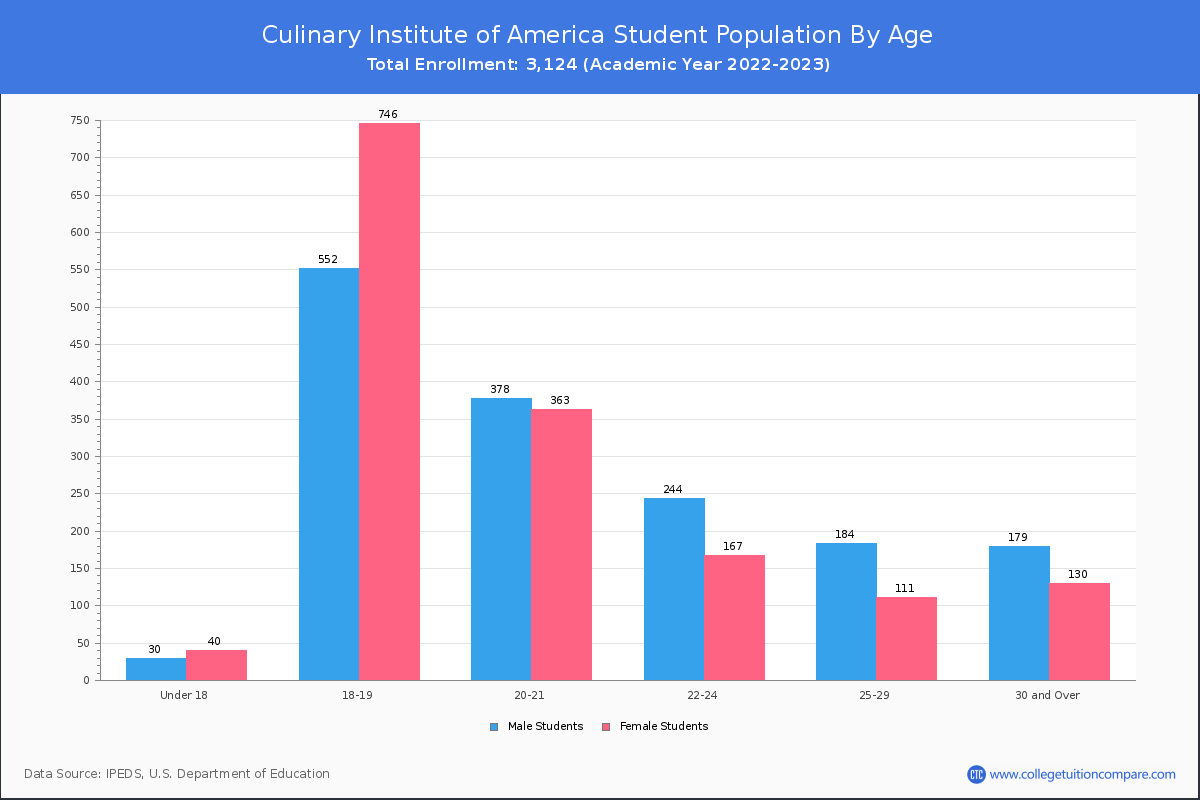
Student Age Distribution
By age, CIA has 70 students under 18 years old and 1 students over 65 years old. There are 2,520 students under 25 years old, and 604 students over 25 years old out of 3,124 total students.
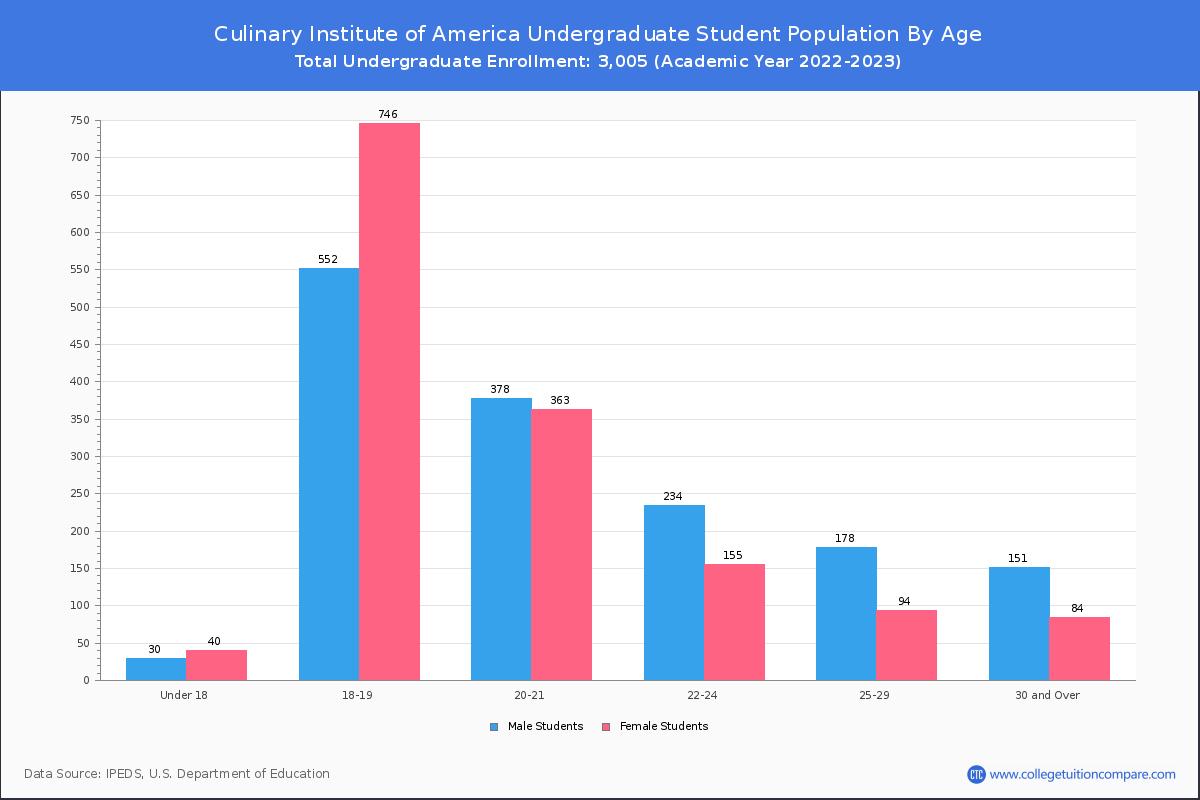
In undergraduate programs, 70 students are younger than 18 and 1 students are older than 65. CIA has 2,498 undergraduate students aged under 25 and 507 students aged 25 and over.
It has 22 graduate students aged under 25 and 97 students aged 25 and over.
| Age | Total | Men | Women |
|---|---|---|---|
| Under 18 | 70 | 40 | 30 |
| 18-19 | 1,298 | 746 | 552 |
| 20-21 | 741 | 363 | 378 |
| 22-24 | 411 | 167 | 244 |
| 25-29 | 295 | 111 | 184 |
| 30-34 | 121 | 53 | 68 |
| 35-39 | 68 | 24 | 44 |
| 40-49 | 62 | 26 | 36 |
| 50-64 | 57 | 27 | 30 |
| Over 65 | 1 | 0 | 1 |
| Age | Total | Men | Women |
|---|---|---|---|
| Under 18 | 70 | 40 | 30 |
| 18-19 | 1,298 | 746 | 552 |
| 20-21 | 741 | 363 | 378 |
| 22-24 | 389 | 155 | 234 |
| 25-29 | 272 | 94 | 178 |
| 30-34 | 98 | 36 | 62 |
| 35-39 | 56 | 18 | 38 |
| 40-49 | 45 | 16 | 29 |
| 50-64 | 35 | 14 | 21 |
| Over 65 | 1 | 0 | 1 |
| Age | Total | Men | Women |
|---|
Online Student Enrollment
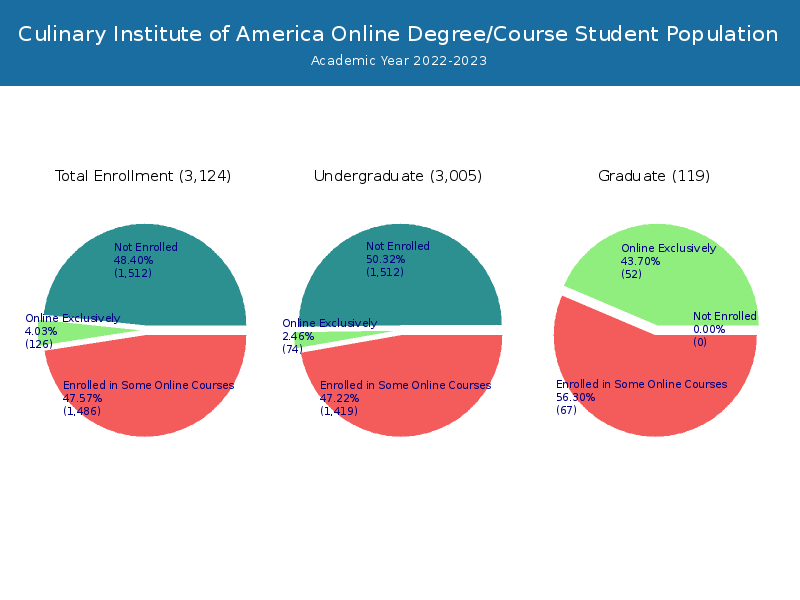
Distance learning, also called online education, is very attractive to students, especially who want to continue education and work in field. At Culinary Institute of America, 126 students are enrolled exclusively in online courses and 1,486 students are enrolled in some online courses.
25 students lived in New York or jurisdiction in which the school is located are enrolled exclusively in online courses and 101 students live in other State or outside of the United States.
| All Students | Enrolled Exclusively Online Courses | Enrolled in Some Online Courses | |
|---|---|---|---|
| All Students | 3,124 | 126 | 1,486 |
| Undergraduate | 3,005 | 74 | 1,419 |
| Graduate | 119 | 52 | 67 |
| New York Residents | Other States in U.S. | Outside of U.S. | |
|---|---|---|---|
| All Students | 25 | 95 | 6 |
| Undergraduate | 18 | 55 | 1 |
| Graduate | 7 | 40 | 5 |
Transfer-in Students (Undergraduate)
Among 3,005 enrolled in undergraduate programs, 415 students have transferred-in from other institutions. The percentage of transfer-in students is 13.81%.
| Number of Students | |
|---|---|
| Regular Full-time | 2,452 |
| Transfer-in Full-time | 415 |