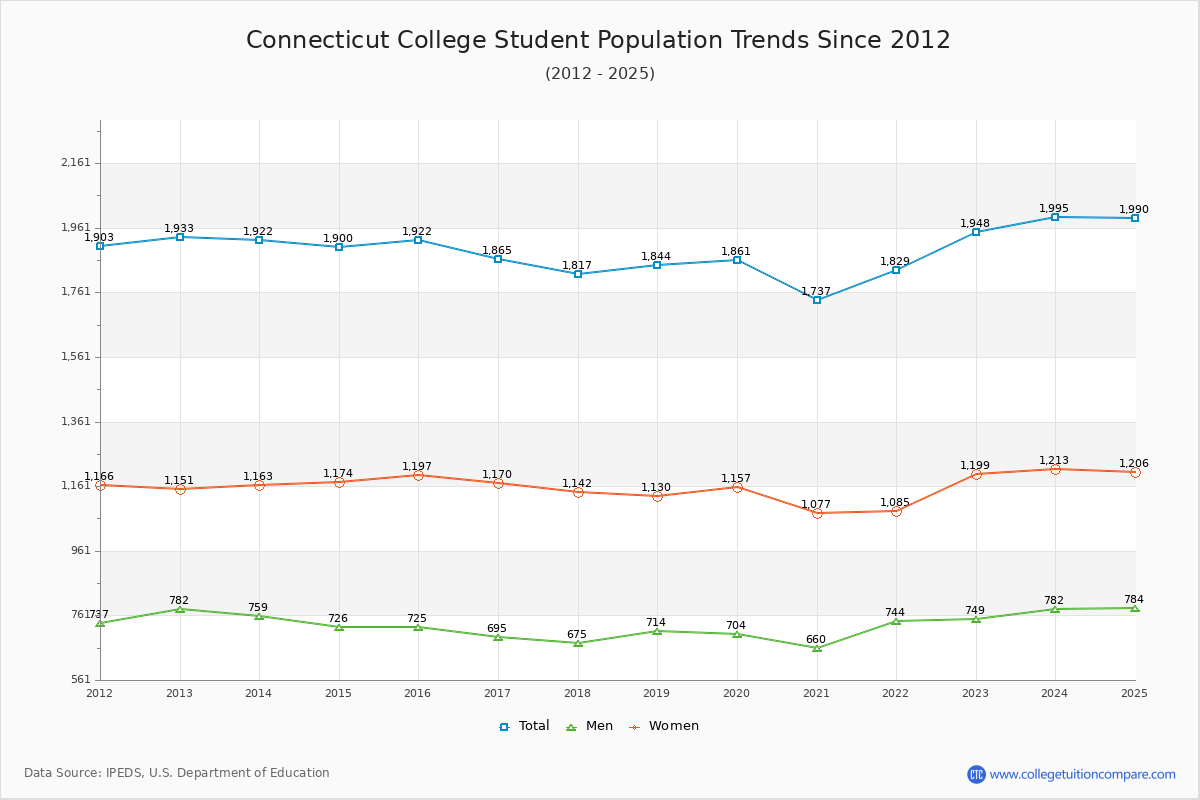
Student Population Changes
The average student population over the last 12 years is 1,868 where 1,948 students are attending the school for the academic year 2022-2023.
The female to male ratio is 1.60 to 1 and it means that there are more female students enrolled in Connecticut than male students.
The following table and chart illustrate the changes in student population by gender at Connecticut College since 2012.
| Year | Total | Men | Women |
|---|---|---|---|
| 2012-13 | 1,926 | 779 | 1,147 |
| 2013-14 | 1,915 -11 | 755 -24 | 1,160 13 |
| 2014-15 | 1,893 -22 | 723 -32 | 1,170 10 |
| 2015-16 | 1,918 25 | 724 1 | 1,194 24 |
| 2016-17 | 1,865 -53 | 695 -29 | 1,170 -24 |
| 2017-18 | 1,817 -48 | 675 -20 | 1,142 -28 |
| 2018-19 | 1,844 27 | 714 39 | 1,130 -12 |
| 2019-20 | 1,861 17 | 704 -10 | 1,157 27 |
| 2020-21 | 1,737 -124 | 660 -44 | 1,077 -80 |
| 2021-22 | 1,829 92 | 744 84 | 1,085 8 |
| 2022-23 | 1,948 119 | 749 5 | 1,199 114 |
| Average | 1,868 | 720 | 1,148 |