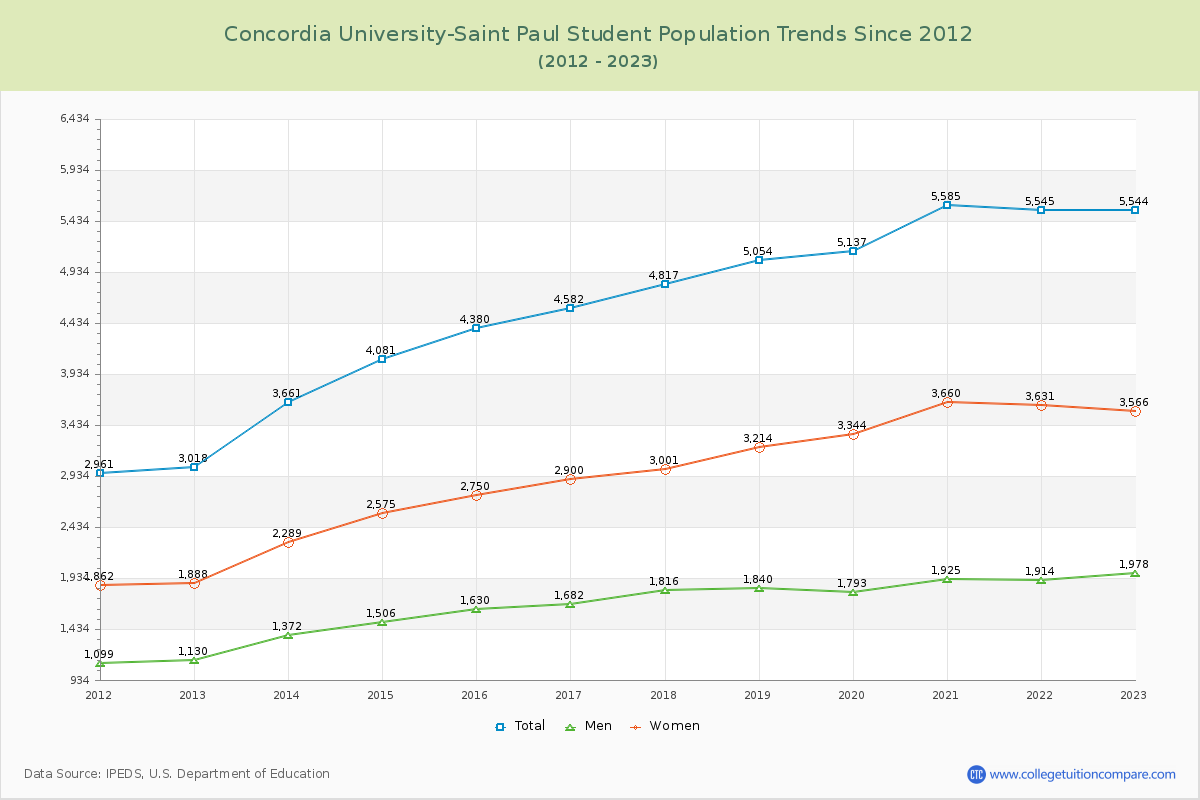
Student Population Changes
The average student population over the last 12 years is 4,673 where 5,544 students are attending the school for the academic year 2022-2023.
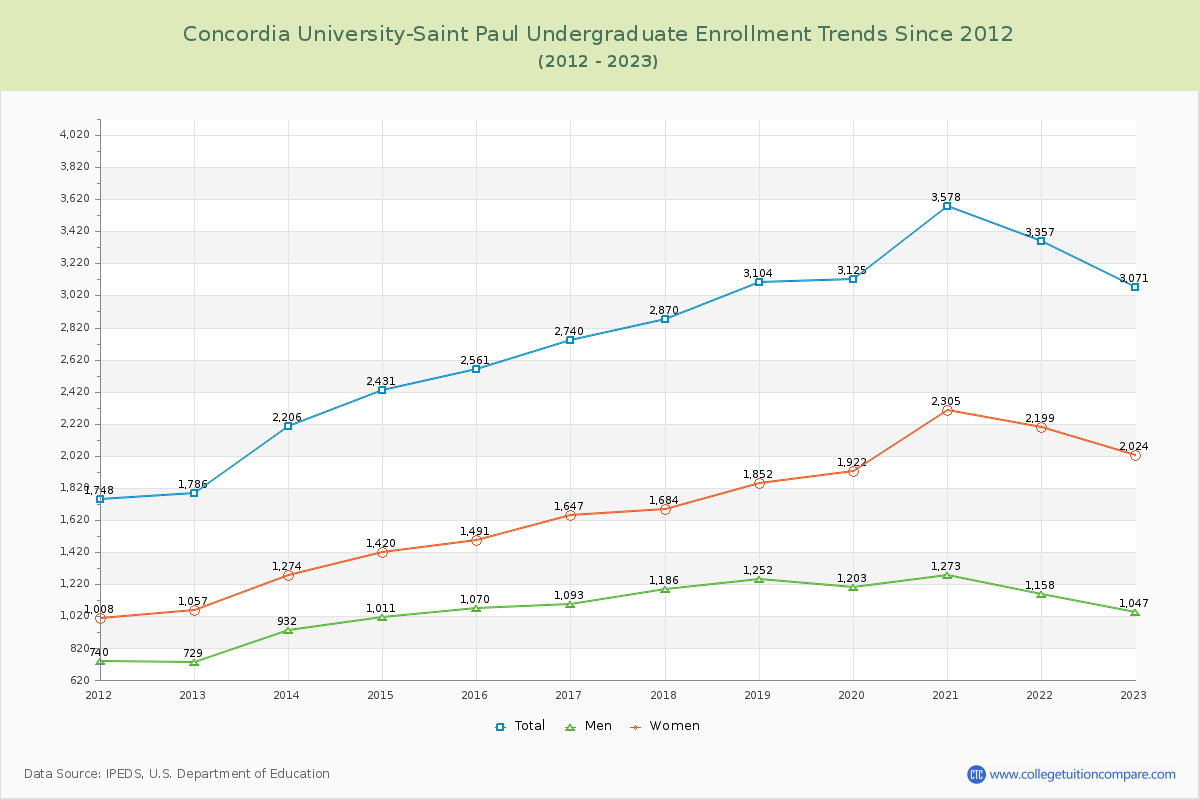
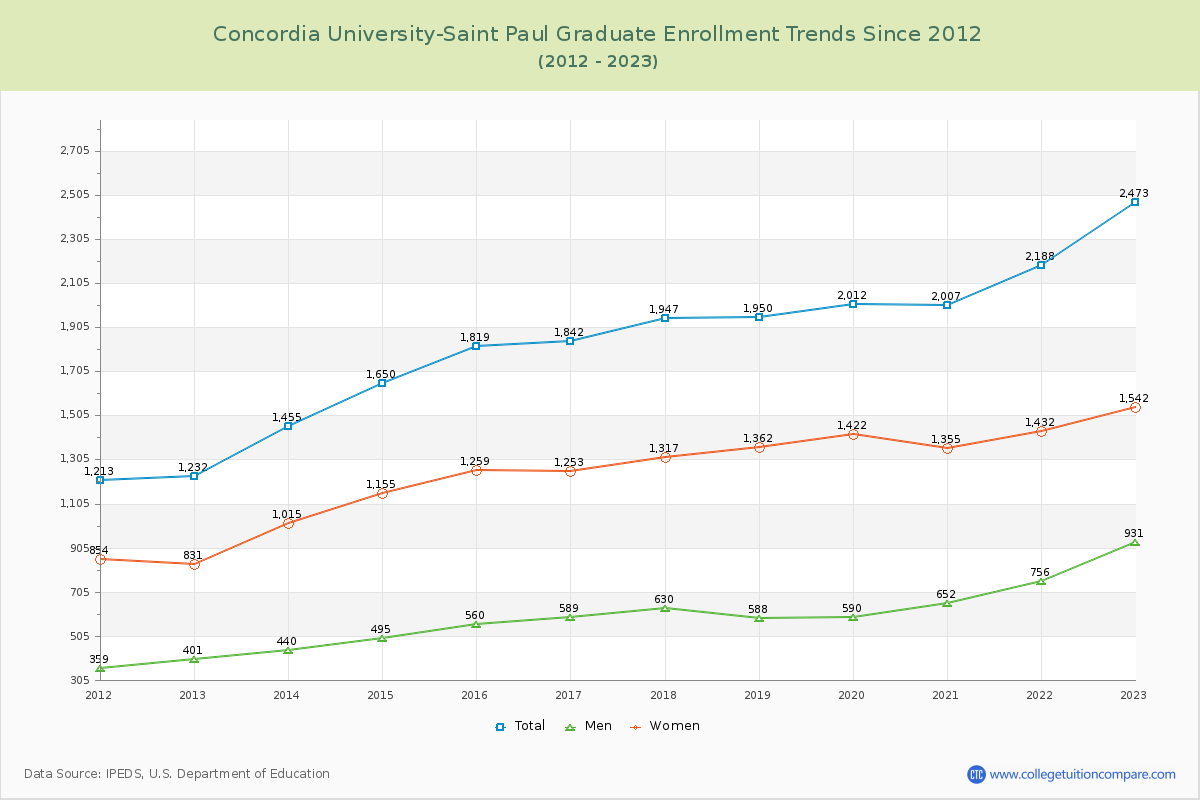
55.39% of total students is undergraduate students and 44.61% students is graduate students. The number of undergraduate students has increased by 1,285 and the graduate enrollment has increased by 1,241 over past 10 years.
The female to male ratio is 1.80 to 1 and it means that there are more female students enrolled in Concordia University-Saint Paul than male students.
The following table and chart illustrate the changes in student population by gender at Concordia University-Saint Paul since 2012.
| Year | Total | Undergraduate | Graduate | ||||
|---|---|---|---|---|---|---|---|
| Total | Men | Women | Total | Men | Women | ||
| 2012-13 | 3,018 | 1,786 | 729 | 1,057 | 1,232 | 401 | 831 |
| 2013-14 | 3,661 643 | 2,206 420 | 932 203 | 1,274 217 | 1,455 223 | 440 39 | 1,015 184 |
| 2014-15 | 4,081 420 | 2,431 225 | 1,011 79 | 1,420 146 | 1,650 195 | 495 55 | 1,155 140 |
| 2015-16 | 4,380 299 | 2,561 130 | 1,070 59 | 1,491 71 | 1,819 169 | 560 65 | 1,259 104 |
| 2016-17 | 4,582 202 | 2,740 179 | 1,093 23 | 1,647 156 | 1,842 23 | 589 29 | 1,253 -6 |
| 2017-18 | 4,817 235 | 2,870 130 | 1,186 93 | 1,684 37 | 1,947 105 | 630 41 | 1,317 64 |
| 2018-19 | 5,054 237 | 3,104 234 | 1,252 66 | 1,852 168 | 1,950 3 | 588 -42 | 1,362 45 |
| 2019-20 | 5,137 83 | 3,125 21 | 1,203 -49 | 1,922 70 | 2,012 62 | 590 2 | 1,422 60 |
| 2020-21 | 5,585 448 | 3,578 453 | 1,273 70 | 2,305 383 | 2,007 -5 | 652 62 | 1,355 -67 |
| 2021-22 | 5,545 -40 | 3,357 -221 | 1,158 -115 | 2,199 -106 | 2,188 181 | 756 104 | 1,432 77 |
| 2022-23 | 5,544 -1 | 3,071 -286 | 1,047 -111 | 2,024 -175 | 2,473 285 | 931 175 | 1,542 110 |
| Average | 4,673 | 2,803 | 1,087 | 1,716 | 1,870 | 603 | 1,268 |