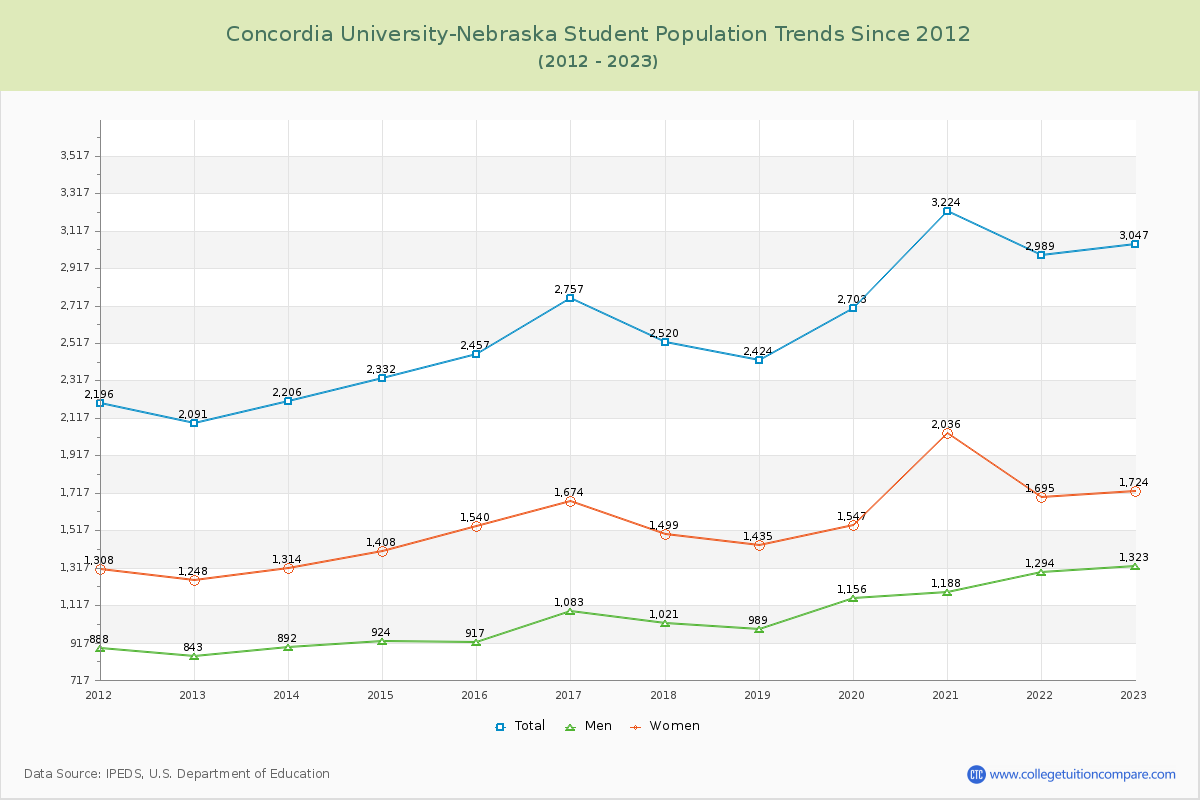
Student Population Changes
The average student population over the last 12 years is 2,614 where 3,047 students are attending the school for the academic year 2022-2023.
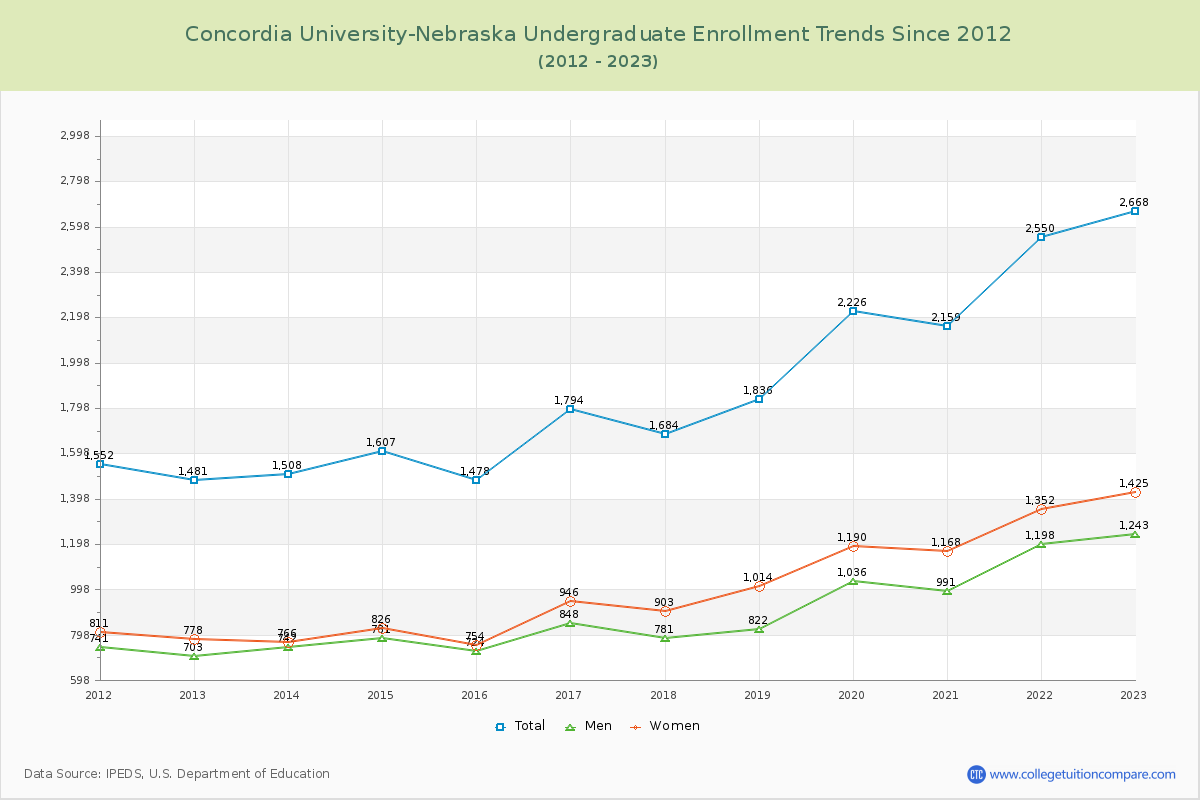
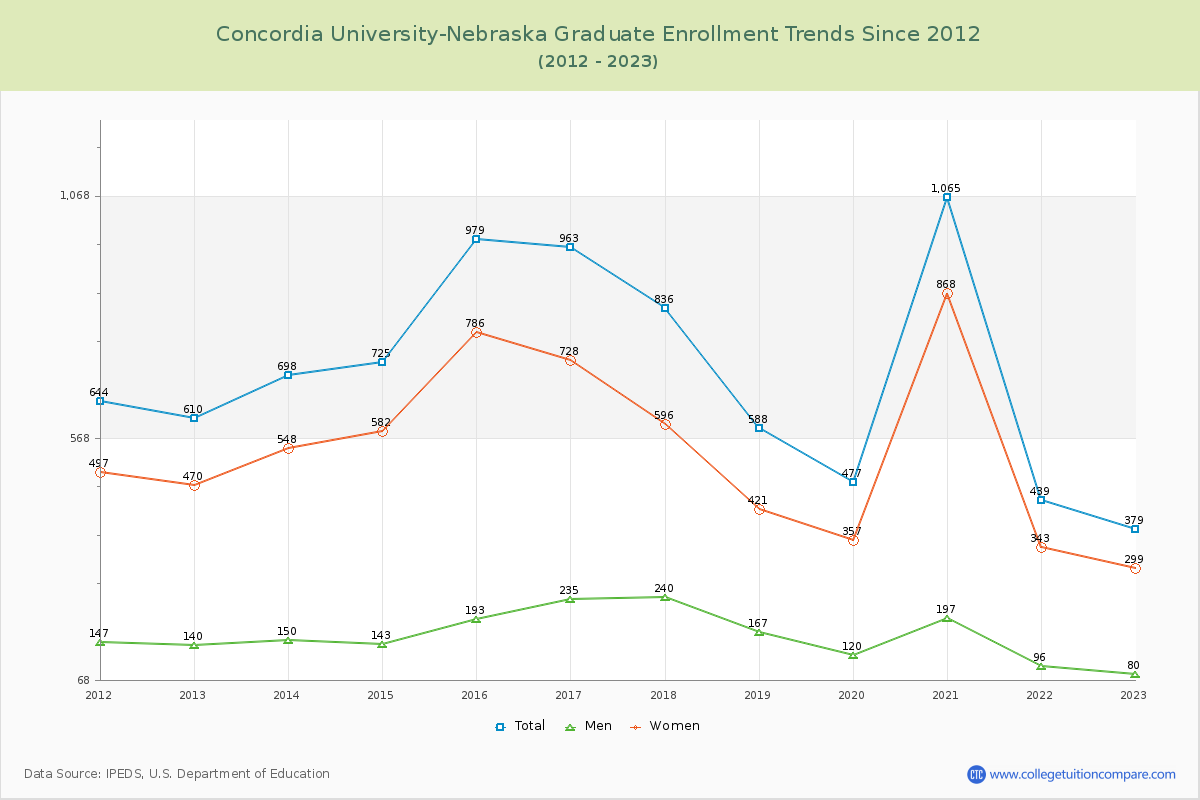
87.56% of total students is undergraduate students and 12.44% students is graduate students. The number of undergraduate students has increased by 1,187 and the graduate enrollment has decreased by 231 over past 10 years.
The female to male ratio is 1.30 to 1 and it means that there are slightly more female students enrolled in Concordia University-Nebraska than male students.
The following table and chart illustrate the changes in student population by gender at Concordia University-Nebraska since 2012.
| Year | Total | Undergraduate | Graduate | ||||
|---|---|---|---|---|---|---|---|
| Total | Men | Women | Total | Men | Women | ||
| 2012-13 | 2,091 | 1,481 | 703 | 778 | 610 | 140 | 470 |
| 2013-14 | 2,206 115 | 1,508 27 | 742 39 | 766 -12 | 698 88 | 150 10 | 548 78 |
| 2014-15 | 2,332 126 | 1,607 99 | 781 39 | 826 60 | 725 27 | 143 -7 | 582 34 |
| 2015-16 | 2,457 125 | 1,478 -129 | 724 -57 | 754 -72 | 979 254 | 193 50 | 786 204 |
| 2016-17 | 2,757 300 | 1,794 316 | 848 124 | 946 192 | 963 -16 | 235 42 | 728 -58 |
| 2017-18 | 2,520 -237 | 1,684 -110 | 781 -67 | 903 -43 | 836 -127 | 240 5 | 596 -132 |
| 2018-19 | 2,424 -96 | 1,836 152 | 822 41 | 1,014 111 | 588 -248 | 167 -73 | 421 -175 |
| 2019-20 | 2,703 279 | 2,226 390 | 1,036 214 | 1,190 176 | 477 -111 | 120 -47 | 357 -64 |
| 2020-21 | 3,224 521 | 2,159 -67 | 991 -45 | 1,168 -22 | 1,065 588 | 197 77 | 868 511 |
| 2021-22 | 2,989 -235 | 2,550 391 | 1,198 207 | 1,352 184 | 439 -626 | 96 -101 | 343 -525 |
| 2022-23 | 3,047 58 | 2,668 118 | 1,243 45 | 1,425 73 | 379 -60 | 80 -16 | 299 -44 |
| Average | 2,614 | 1,908 | 897 | 1,011 | 705 | 160 | 545 |