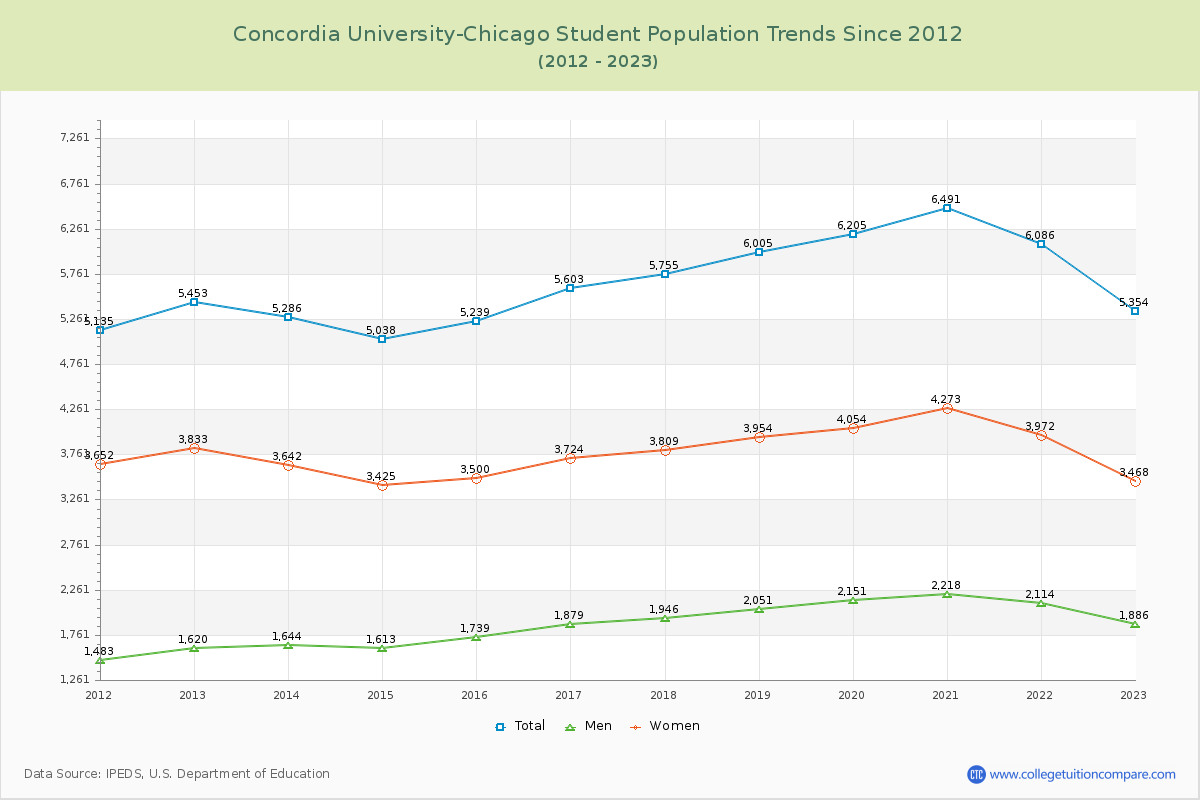
Student Population Changes
The average student population over the last 12 years is 5,683 where 5,354 students are attending the school for the academic year 2022-2023.
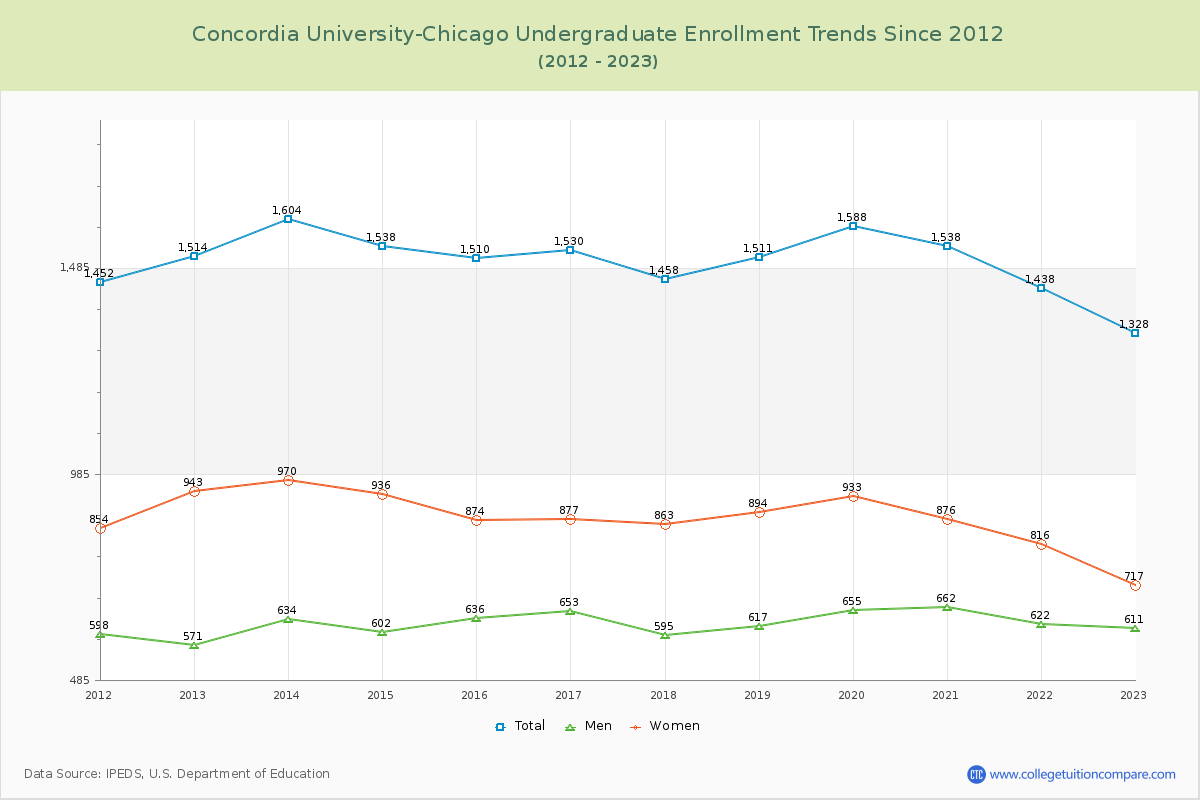
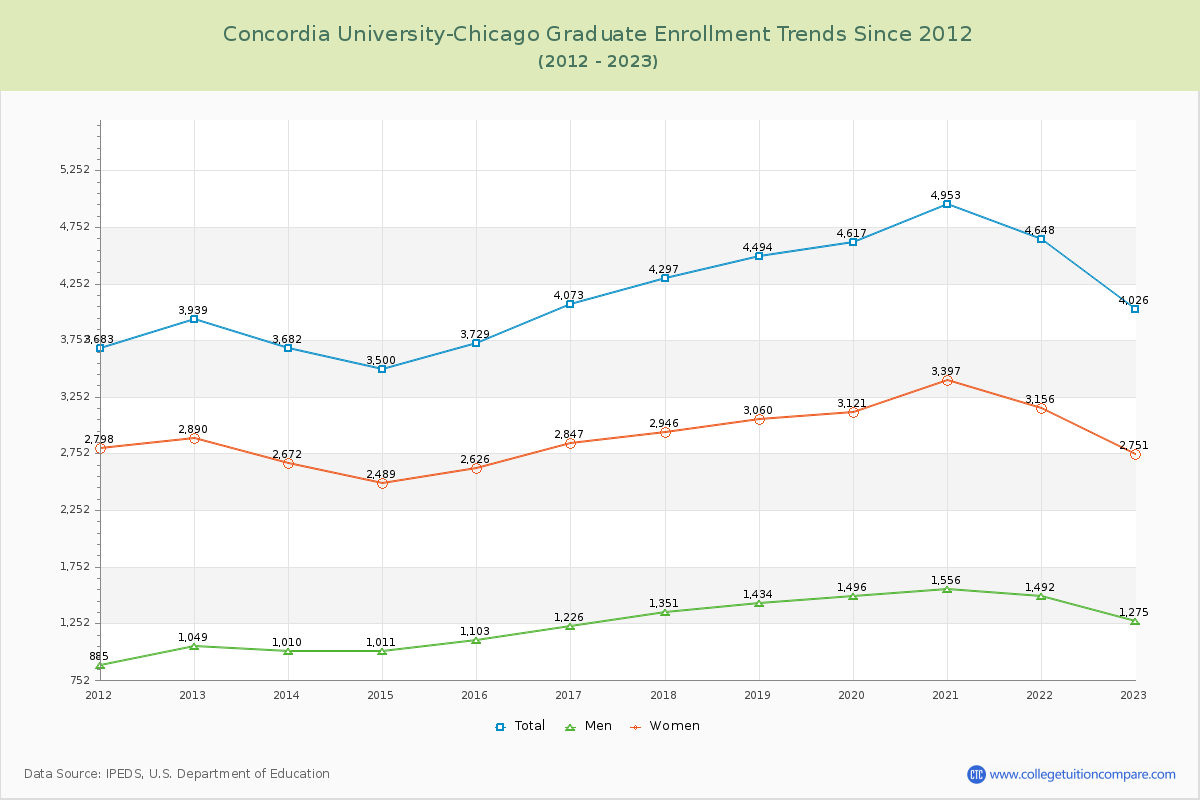
24.80% of total students is undergraduate students and 75.20% students is graduate students. The number of undergraduate students has decreased by 186 and the graduate enrollment has increased by 87 over past 10 years.
The female to male ratio is 1.84 to 1 and it means that there are more female students enrolled in Concordia University-Chicago than male students.
The following table and chart illustrate the changes in student population by gender at Concordia University-Chicago since 2012.
| Year | Total | Undergraduate | Graduate | ||||
|---|---|---|---|---|---|---|---|
| Total | Men | Women | Total | Men | Women | ||
| 2012-13 | 5,453 | 1,514 | 571 | 943 | 3,939 | 1,049 | 2,890 |
| 2013-14 | 5,286 -167 | 1,604 90 | 634 63 | 970 27 | 3,682 -257 | 1,010 -39 | 2,672 -218 |
| 2014-15 | 5,038 -248 | 1,538 -66 | 602 -32 | 936 -34 | 3,500 -182 | 1,011 1 | 2,489 -183 |
| 2015-16 | 5,239 201 | 1,510 -28 | 636 34 | 874 -62 | 3,729 229 | 1,103 92 | 2,626 137 |
| 2016-17 | 5,603 364 | 1,530 20 | 653 17 | 877 3 | 4,073 344 | 1,226 123 | 2,847 221 |
| 2017-18 | 5,755 152 | 1,458 -72 | 595 -58 | 863 -14 | 4,297 224 | 1,351 125 | 2,946 99 |
| 2018-19 | 6,005 250 | 1,511 53 | 617 22 | 894 31 | 4,494 197 | 1,434 83 | 3,060 114 |
| 2019-20 | 6,205 200 | 1,588 77 | 655 38 | 933 39 | 4,617 123 | 1,496 62 | 3,121 61 |
| 2020-21 | 6,491 286 | 1,538 -50 | 662 7 | 876 -57 | 4,953 336 | 1,556 60 | 3,397 276 |
| 2021-22 | 6,086 -405 | 1,438 -100 | 622 -40 | 816 -60 | 4,648 -305 | 1,492 -64 | 3,156 -241 |
| 2022-23 | 5,354 -732 | 1,328 -110 | 611 -11 | 717 -99 | 4,026 -622 | 1,275 -217 | 2,751 -405 |
| Average | 5,683 | 1,505 | 623 | 882 | 4,178 | 1,273 | 2,905 |