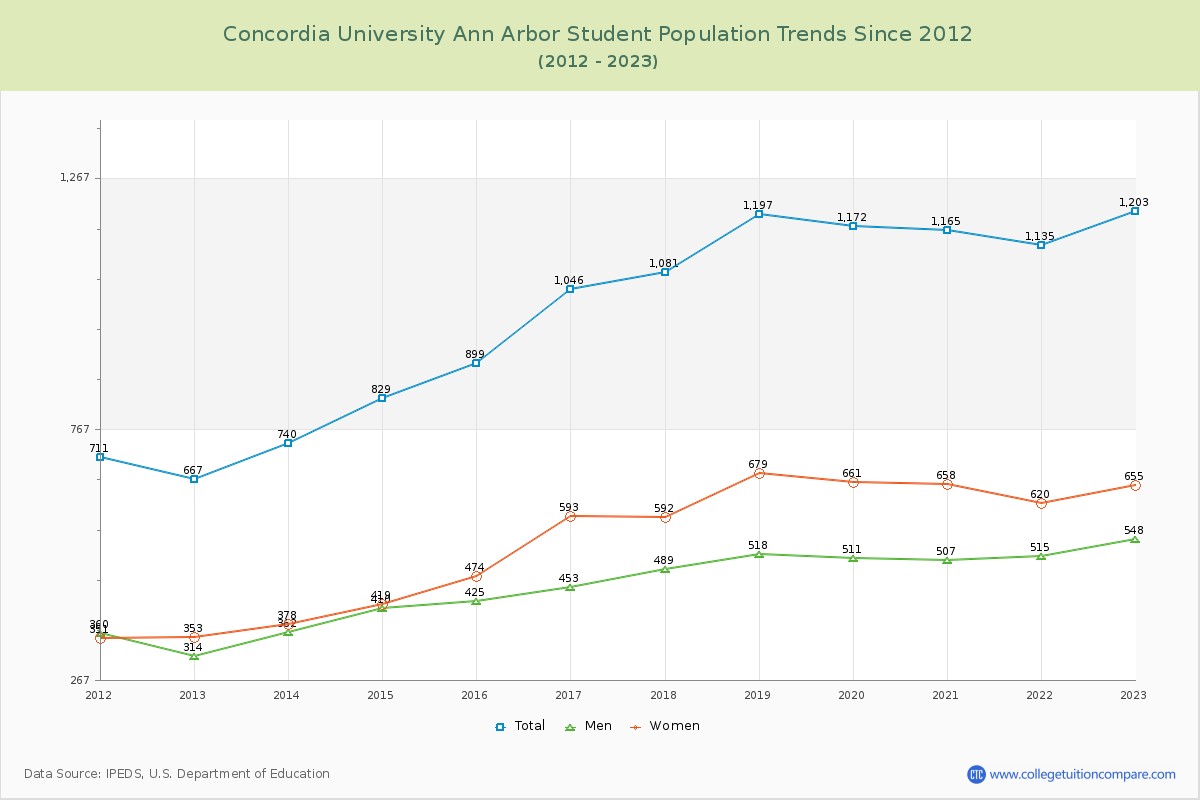
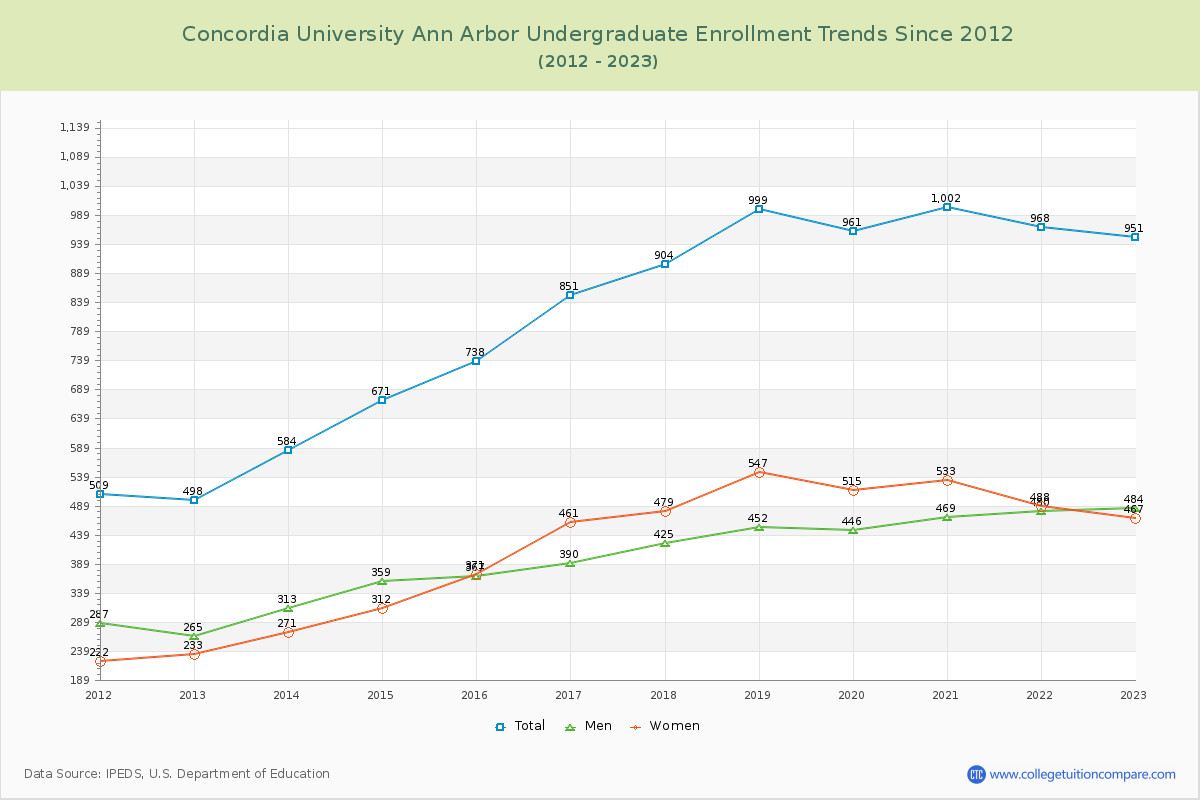
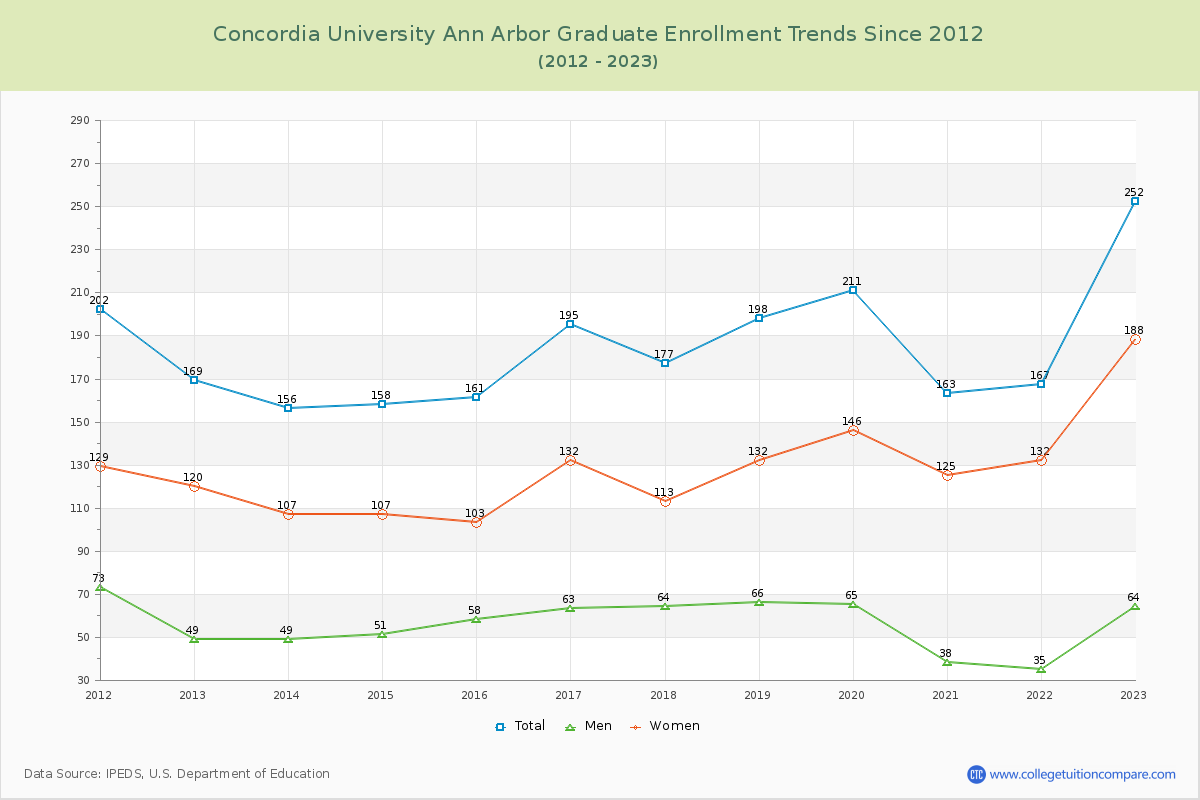
Student Population Changes
The average student population over the last 12 years is 1,012 where 1,203 students are attending the school for the academic year 2022-2023.
79.05% of total students is undergraduate students and 20.95% students is graduate students. The number of undergraduate students has increased by 453 and the graduate enrollment has increased by 83 over past 10 years.
The female to male ratio is 1.20 to 1 and it means that there are slightly more female students enrolled in CUAA than male students.
The following table and chart illustrate the changes in student population by gender at Concordia University Ann Arbor since 2012.
| Year | Total | Undergraduate | Graduate | ||||
|---|---|---|---|---|---|---|---|
| Total | Men | Women | Total | Men | Women | ||
| 2012-13 | 667 | 498 | 265 | 233 | 169 | 49 | 120 |
| 2013-14 | 740 73 | 584 86 | 313 48 | 271 38 | 156 -13 | 49 0 | 107 -13 |
| 2014-15 | 829 89 | 671 87 | 359 46 | 312 41 | 158 2 | 51 2 | 107 0 |
| 2015-16 | 899 70 | 738 67 | 367 8 | 371 59 | 161 3 | 58 7 | 103 -4 |
| 2016-17 | 1,046 147 | 851 113 | 390 23 | 461 90 | 195 34 | 63 5 | 132 29 |
| 2017-18 | 1,081 35 | 904 53 | 425 35 | 479 18 | 177 -18 | 64 1 | 113 -19 |
| 2018-19 | 1,197 116 | 999 95 | 452 27 | 547 68 | 198 21 | 66 2 | 132 19 |
| 2019-20 | 1,172 -25 | 961 -38 | 446 -6 | 515 -32 | 211 13 | 65 -1 | 146 14 |
| 2020-21 | 1,165 -7 | 1,002 41 | 469 23 | 533 18 | 163 -48 | 38 -27 | 125 -21 |
| 2021-22 | 1,135 -30 | 968 -34 | 480 11 | 488 -45 | 167 4 | 35 -3 | 132 7 |
| 2022-23 | 1,203 68 | 951 -17 | 484 4 | 467 -21 | 252 85 | 64 29 | 188 56 |
| Average | 1,012 | 830 | 405 | 425 | 182 | 55 | 128 |