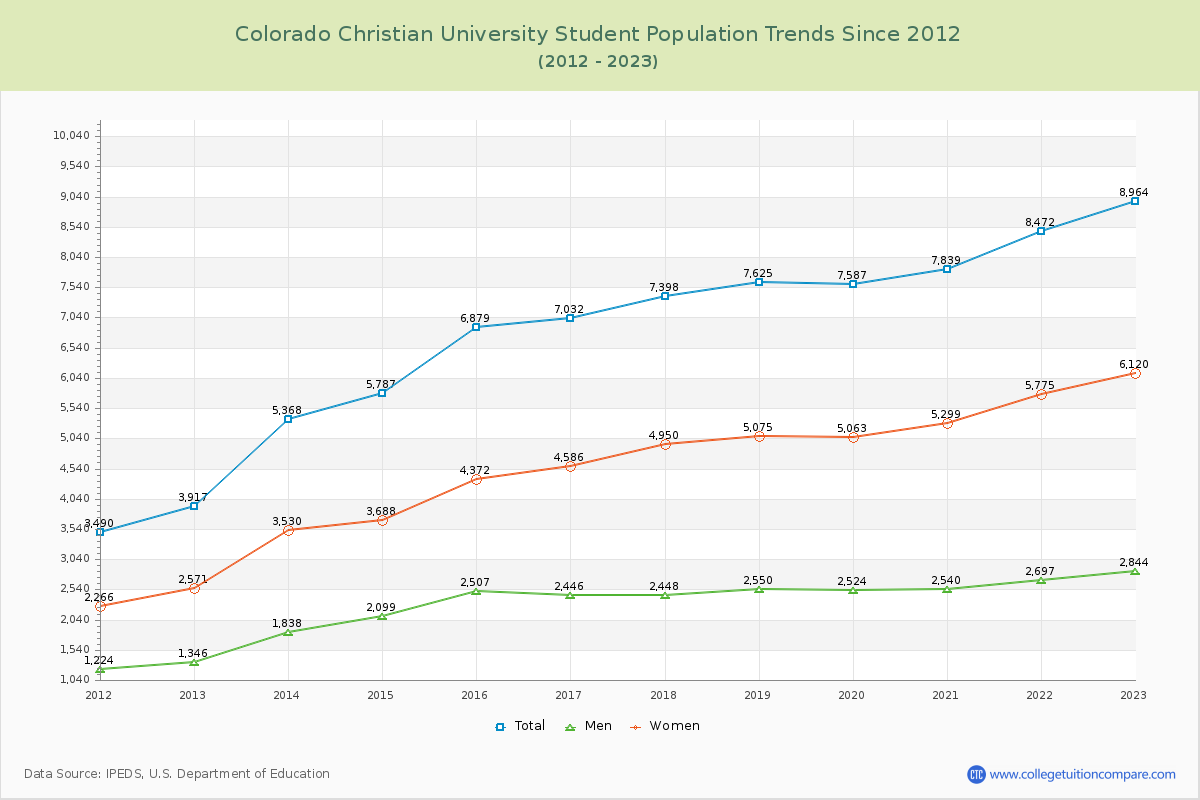
Student Population Changes
The average student population over the last 12 years is 6,988 where 8,964 students are attending the school for the academic year 2022-2023.
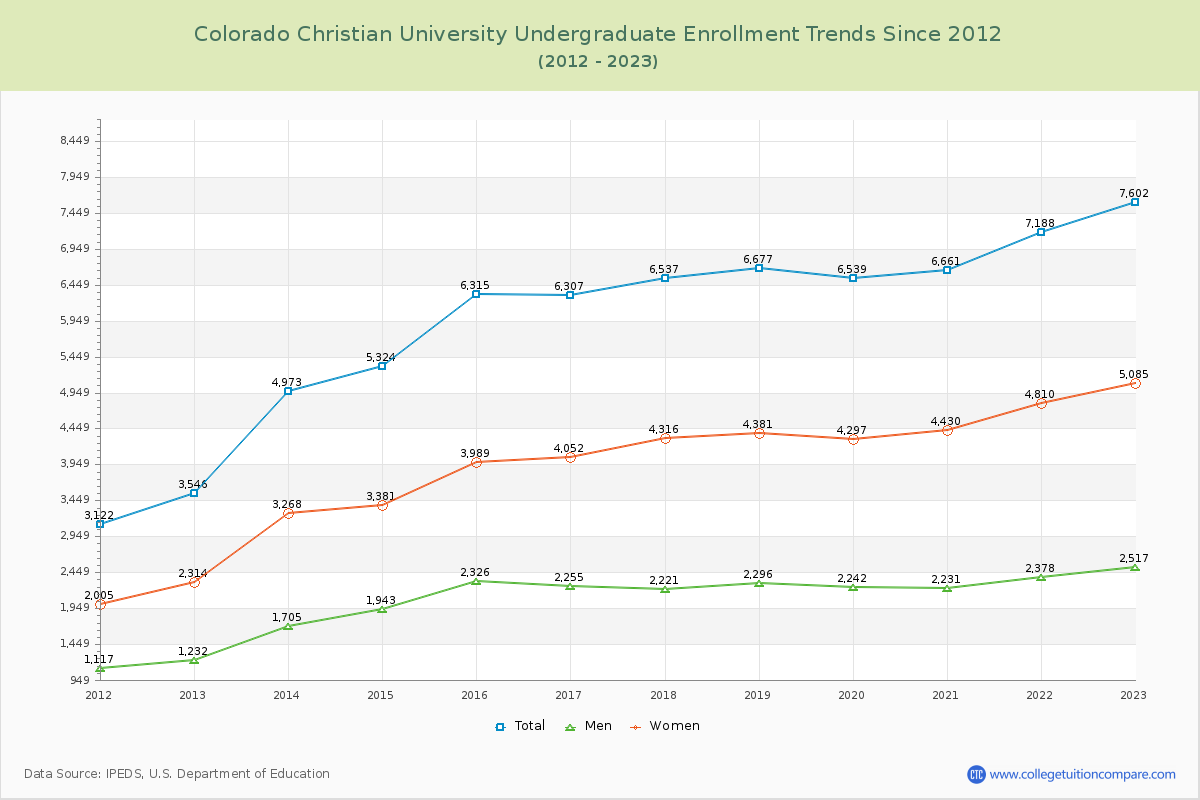
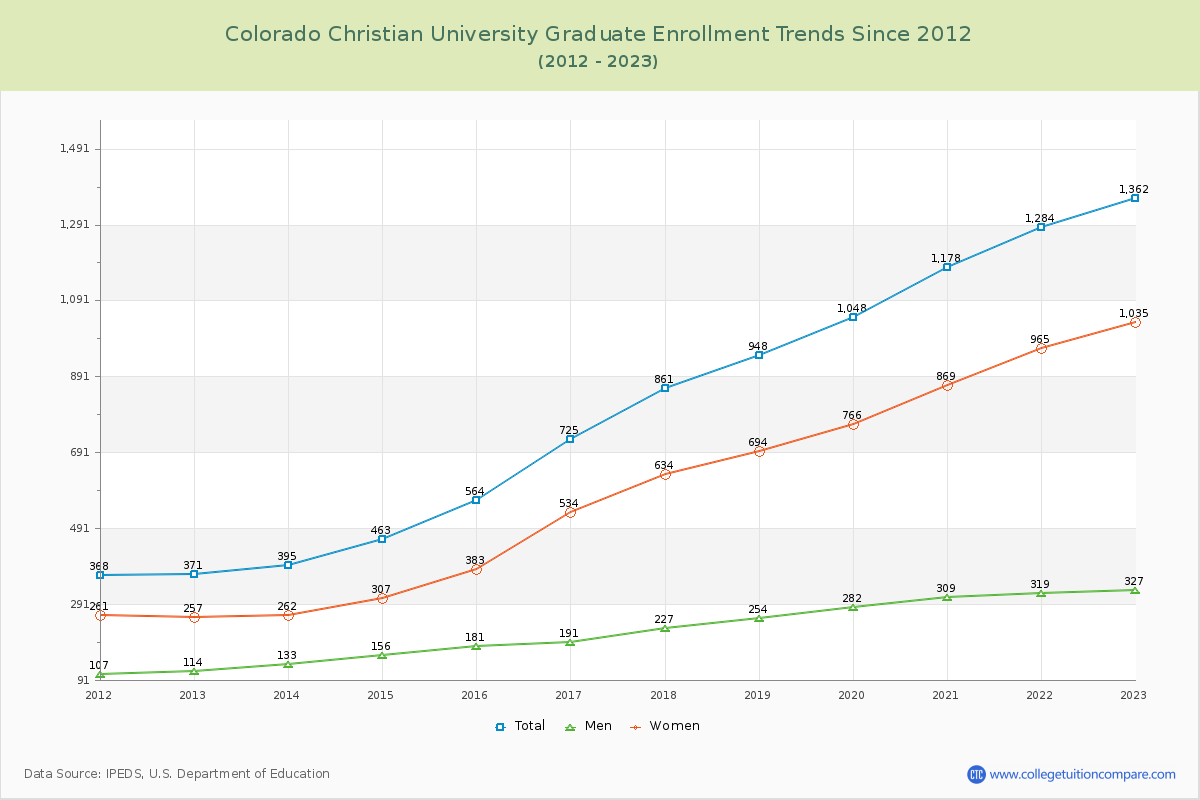
84.81% of total students is undergraduate students and 15.19% students is graduate students. The number of undergraduate students has increased by 4,056 and the graduate enrollment has increased by 991 over past 10 years.
The female to male ratio is 2.15 to 1 and it means that there are far more female students enrolled in CCU than male students.
The following table and chart illustrate the changes in student population by gender at Colorado Christian University since 2012.
| Year | Total | Undergraduate | Graduate | ||||
|---|---|---|---|---|---|---|---|
| Total | Men | Women | Total | Men | Women | ||
| 2012-13 | 3,917 | 3,546 | 1,232 | 2,314 | 371 | 114 | 257 |
| 2013-14 | 5,368 1,451 | 4,973 1,427 | 1,705 473 | 3,268 954 | 395 24 | 133 19 | 262 5 |
| 2014-15 | 5,787 419 | 5,324 351 | 1,943 238 | 3,381 113 | 463 68 | 156 23 | 307 45 |
| 2015-16 | 6,879 1,092 | 6,315 991 | 2,326 383 | 3,989 608 | 564 101 | 181 25 | 383 76 |
| 2016-17 | 7,032 153 | 6,307 -8 | 2,255 -71 | 4,052 63 | 725 161 | 191 10 | 534 151 |
| 2017-18 | 7,398 366 | 6,537 230 | 2,221 -34 | 4,316 264 | 861 136 | 227 36 | 634 100 |
| 2018-19 | 7,625 227 | 6,677 140 | 2,296 75 | 4,381 65 | 948 87 | 254 27 | 694 60 |
| 2019-20 | 7,587 -38 | 6,539 -138 | 2,242 -54 | 4,297 -84 | 1,048 100 | 282 28 | 766 72 |
| 2020-21 | 7,839 252 | 6,661 122 | 2,231 -11 | 4,430 133 | 1,178 130 | 309 27 | 869 103 |
| 2021-22 | 8,472 633 | 7,188 527 | 2,378 147 | 4,810 380 | 1,284 106 | 319 10 | 965 96 |
| 2022-23 | 8,964 492 | 7,602 414 | 2,517 139 | 5,085 275 | 1,362 78 | 327 8 | 1,035 70 |
| Average | 6,988 | 6,152 | 2,122 | 4,029 | 836 | 227 | 610 |