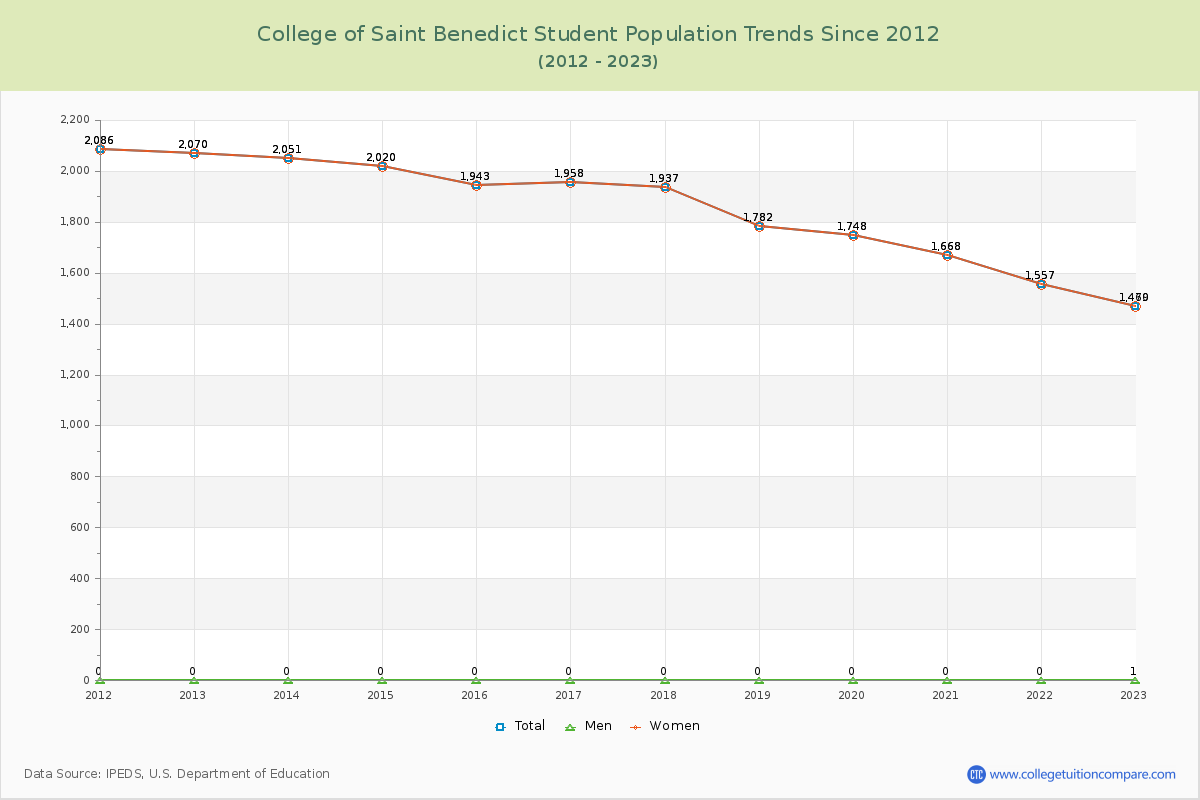
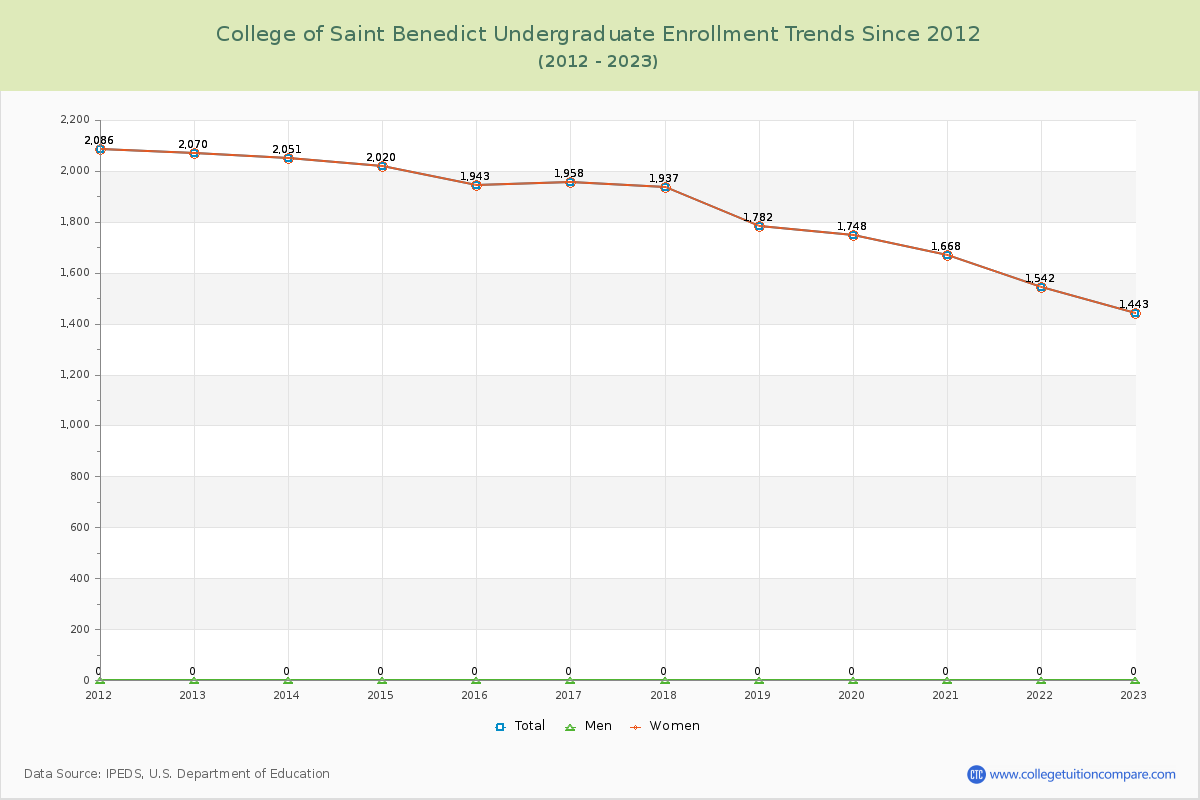
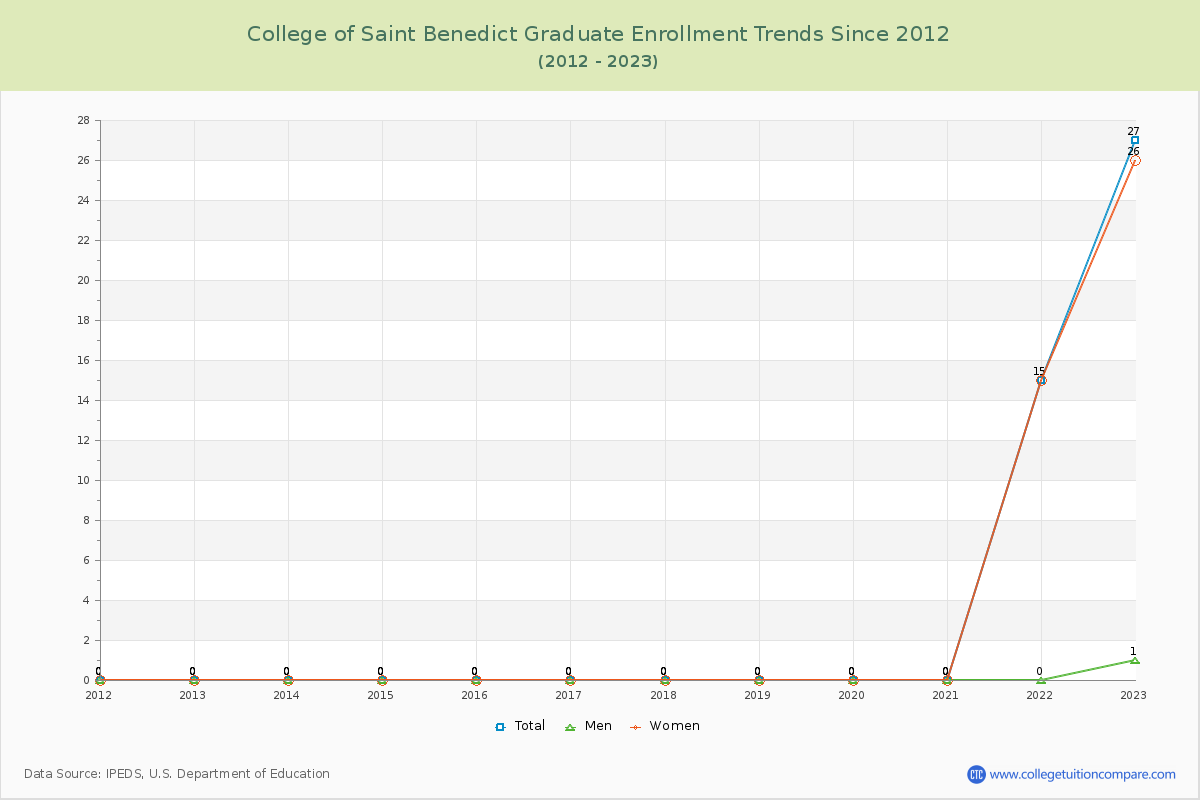
Student Population Changes
The average student population over the last 12 years is 1,837 where 1,470 students are attending the school for the academic year 2022-2023.
98.16% of total students is undergraduate students and 1.84% students is graduate students. The number of undergraduate students has decreased by 627 and the graduate enrollment has increased by 27 over past 10 years.
The following table and chart illustrate the changes in student population by gender at College of Saint Benedict since 2012.
| Year | Total | Undergraduate | Graduate | ||||
|---|---|---|---|---|---|---|---|
| Total | Men | Women | Total | Men | Women | ||
| 2012-13 | 2,070 | 2,070 | 0 | 2,070 | 0 | 0 | 0 |
| 2013-14 | 2,051 -19 | 2,051 -19 | 0 0 | 2,051 -19 | 0 0 | 0 0 | 0 0 |
| 2014-15 | 2,020 -31 | 2,020 -31 | 0 0 | 2,020 -31 | 0 0 | 0 0 | 0 0 |
| 2015-16 | 1,943 -77 | 1,943 -77 | 0 0 | 1,943 -77 | 0 0 | 0 0 | 0 0 |
| 2016-17 | 1,958 15 | 1,958 15 | 0 0 | 1,958 15 | 0 0 | 0 0 | 0 0 |
| 2017-18 | 1,937 -21 | 1,937 -21 | 0 0 | 1,937 -21 | 0 0 | 0 0 | 0 0 |
| 2018-19 | 1,782 -155 | 1,782 -155 | 0 0 | 1,782 -155 | 0 0 | 0 0 | 0 0 |
| 2019-20 | 1,748 -34 | 1,748 -34 | 0 0 | 1,748 -34 | 0 0 | 0 0 | 0 0 |
| 2020-21 | 1,668 -80 | 1,668 -80 | 0 0 | 1,668 -80 | 0 0 | 0 0 | 0 0 |
| 2021-22 | 1,557 -111 | 1,542 -126 | 0 0 | 1,542 -126 | 15 15 | 0 0 | 15 15 |
| 2022-23 | 1,470 -87 | 1,443 -99 | 0 0 | 1,443 -99 | 27 12 | 1 1 | 26 11 |
| Average | 1,837 | 1,833 | 0 | 1,833 | 4 | 0 | 4 |