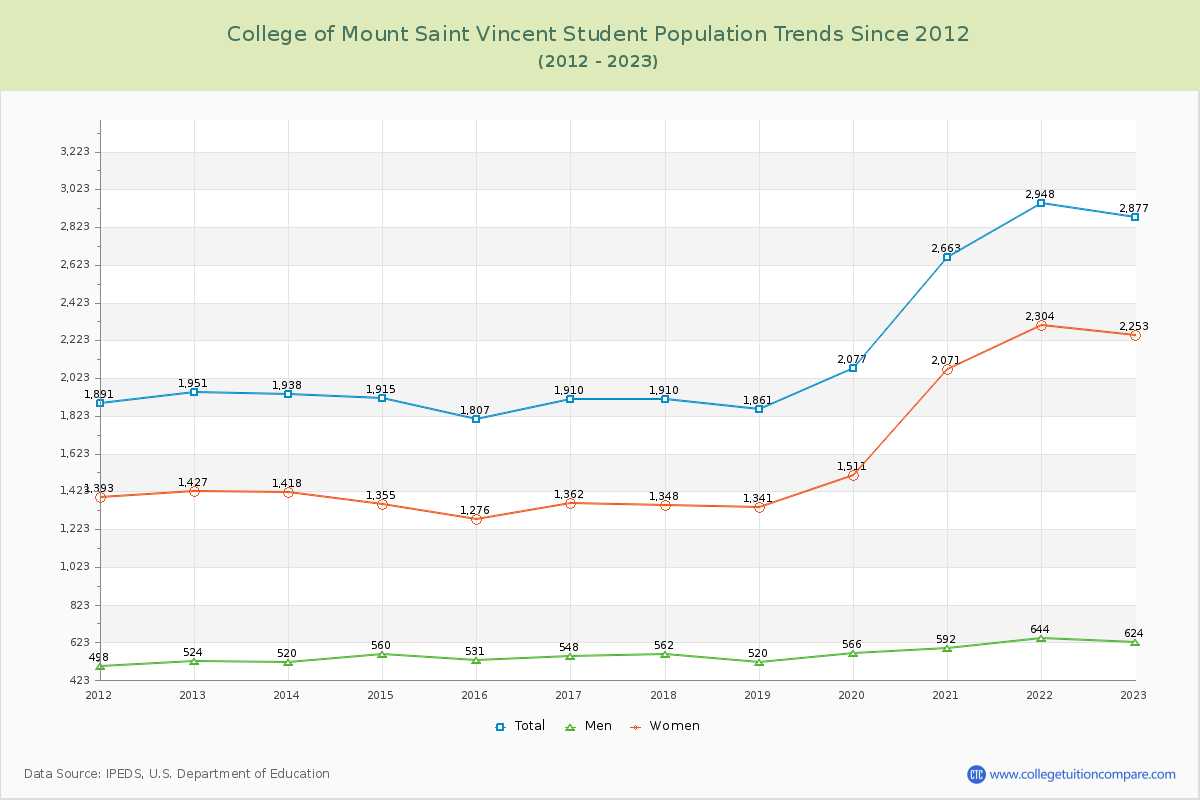
Student Population Changes
The average student population over the last 12 years is 2,169 where 2,877 students are attending the school for the academic year 2022-2023.
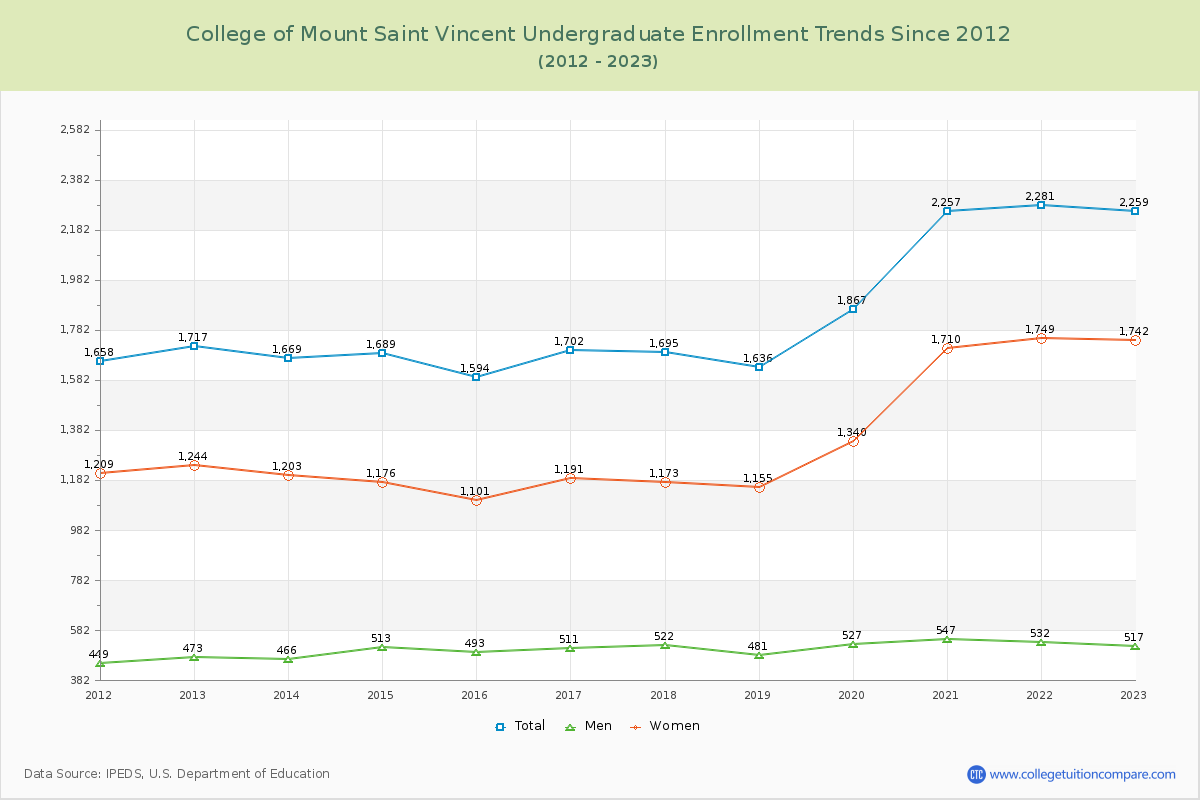
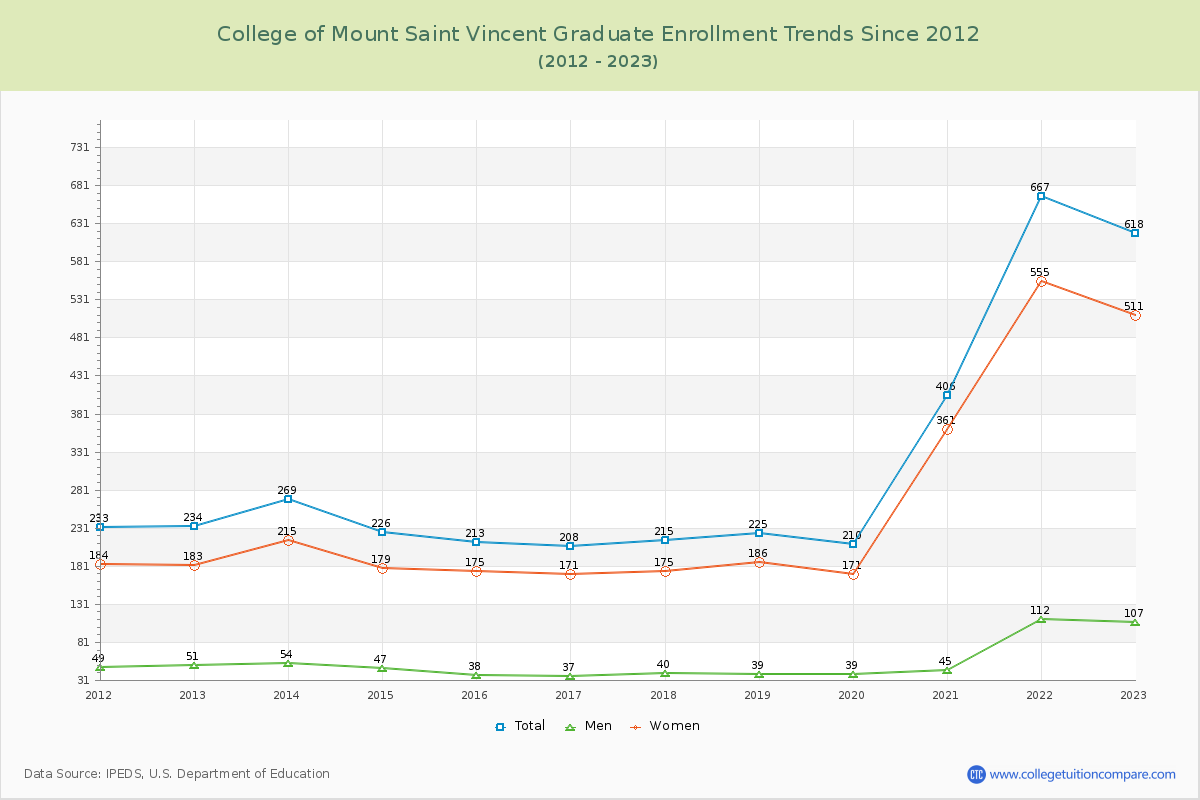
78.52% of total students is undergraduate students and 21.48% students is graduate students. The number of undergraduate students has increased by 542 and the graduate enrollment has increased by 384 over past 10 years.
The female to male ratio is 3.61 to 1 and it means that there are far more female students enrolled in C of Mount Saint Vincent than male students.
The following table and chart illustrate the changes in student population by gender at College of Mount Saint Vincent since 2012.
| Year | Total | Undergraduate | Graduate | ||||
|---|---|---|---|---|---|---|---|
| Total | Men | Women | Total | Men | Women | ||
| 2012-13 | 1,951 | 1,717 | 473 | 1,244 | 234 | 51 | 183 |
| 2013-14 | 1,938 -13 | 1,669 -48 | 466 -7 | 1,203 -41 | 269 35 | 54 3 | 215 32 |
| 2014-15 | 1,915 -23 | 1,689 20 | 513 47 | 1,176 -27 | 226 -43 | 47 -7 | 179 -36 |
| 2015-16 | 1,807 -108 | 1,594 -95 | 493 -20 | 1,101 -75 | 213 -13 | 38 -9 | 175 -4 |
| 2016-17 | 1,910 103 | 1,702 108 | 511 18 | 1,191 90 | 208 -5 | 37 -1 | 171 -4 |
| 2017-18 | 1,910 0 | 1,695 -7 | 522 11 | 1,173 -18 | 215 7 | 40 3 | 175 4 |
| 2018-19 | 1,861 -49 | 1,636 -59 | 481 -41 | 1,155 -18 | 225 10 | 39 -1 | 186 11 |
| 2019-20 | 2,077 216 | 1,867 231 | 527 46 | 1,340 185 | 210 -15 | 39 0 | 171 -15 |
| 2020-21 | 2,663 586 | 2,257 390 | 547 20 | 1,710 370 | 406 196 | 45 6 | 361 190 |
| 2021-22 | 2,948 285 | 2,281 24 | 532 -15 | 1,749 39 | 667 261 | 112 67 | 555 194 |
| 2022-23 | 2,877 -71 | 2,259 -22 | 517 -15 | 1,742 -7 | 618 -49 | 107 -5 | 511 -44 |
| Average | 2,169 | 1,851 | 507 | 1,344 | 317 | 55 | 262 |