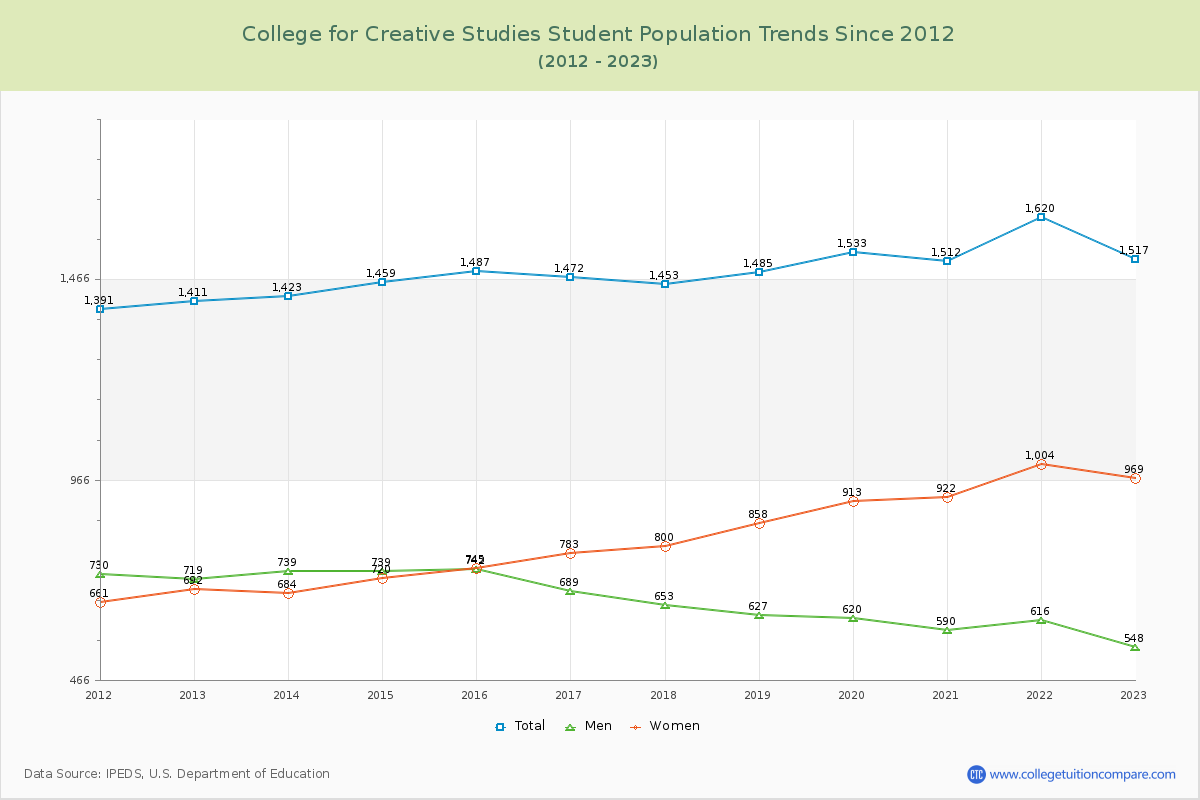
Student Population Changes
The average student population over the last 12 years is 1,488 where 1,517 students are attending the school for the academic year 2022-2023.
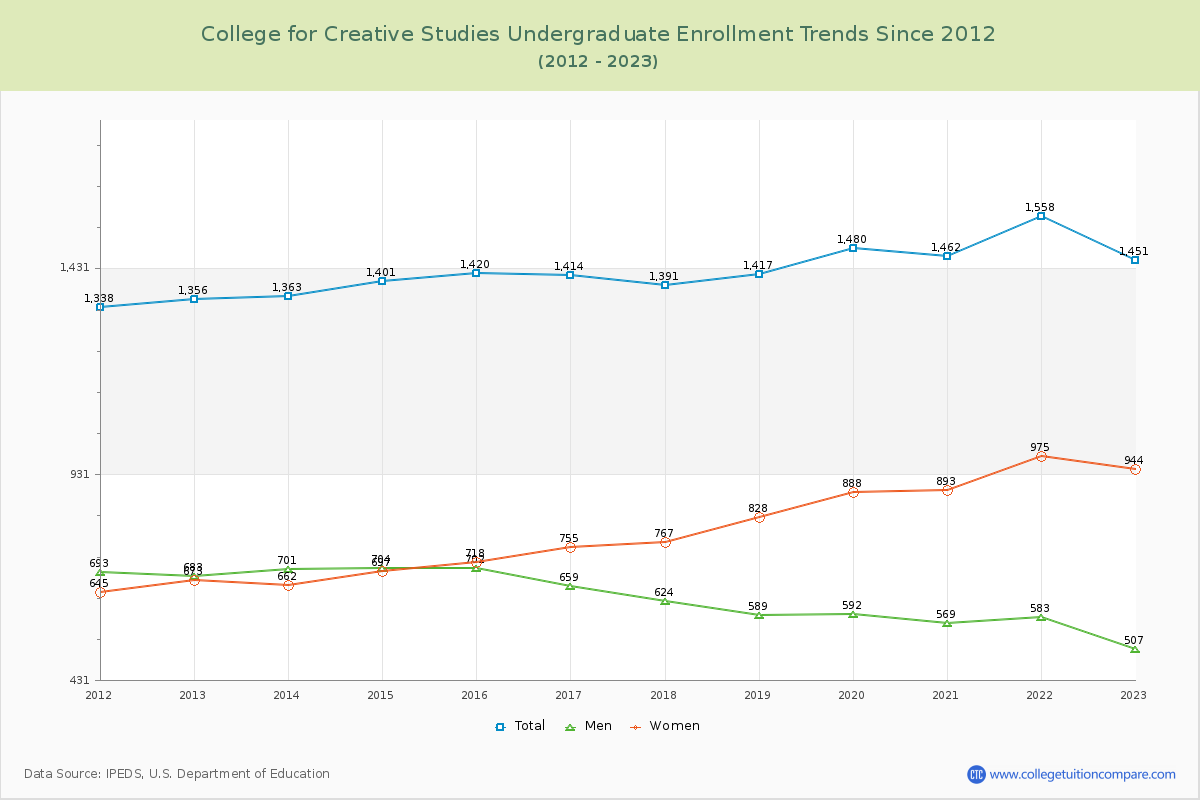
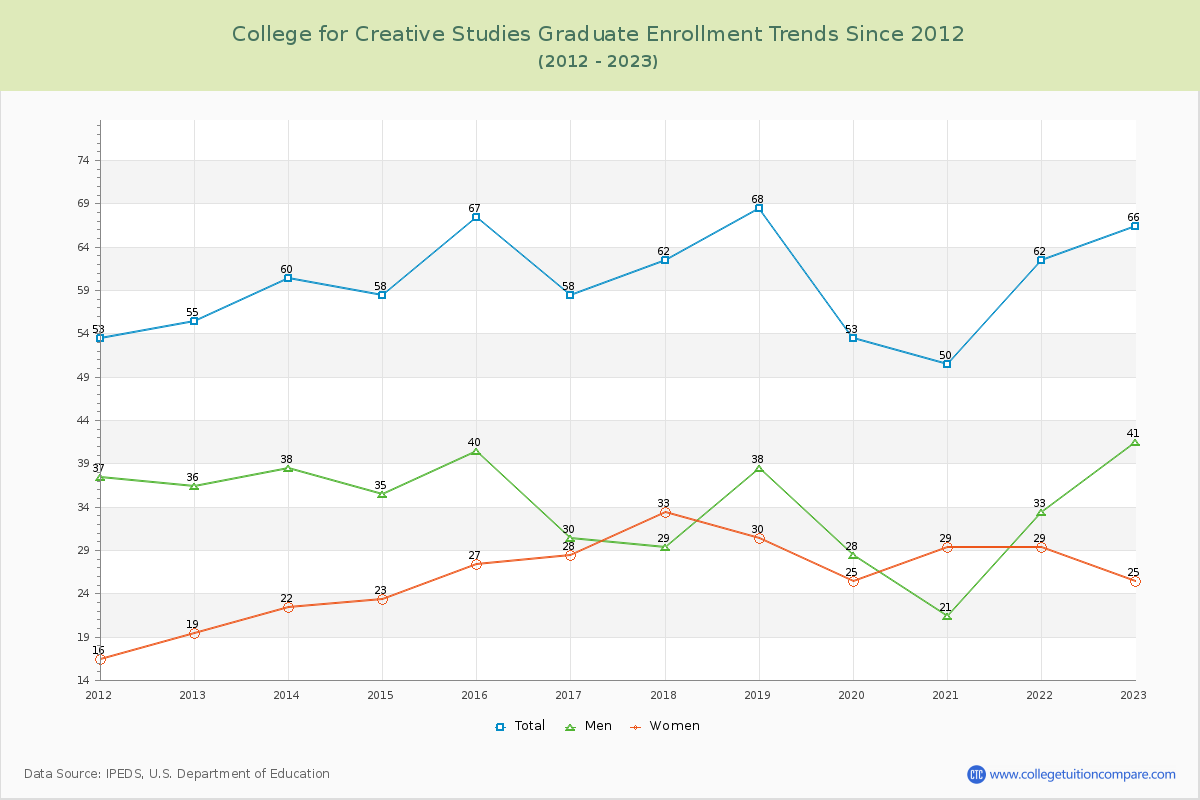
95.65% of total students is undergraduate students and 4.35% students is graduate students. The number of undergraduate students has increased by 95 and the graduate enrollment has increased by 11 over past 10 years.
The female to male ratio is 1.77 to 1 and it means that there are more female students enrolled in CCS than male students.
The following table and chart illustrate the changes in student population by gender at College for Creative Studies since 2012.
| Year | Total | Undergraduate | Graduate | ||||
|---|---|---|---|---|---|---|---|
| Total | Men | Women | Total | Men | Women | ||
| 2012-13 | 1,411 | 1,356 | 683 | 673 | 55 | 36 | 19 |
| 2013-14 | 1,423 12 | 1,363 7 | 701 18 | 662 -11 | 60 5 | 38 2 | 22 3 |
| 2014-15 | 1,459 36 | 1,401 38 | 704 3 | 697 35 | 58 -2 | 35 -3 | 23 1 |
| 2015-16 | 1,487 28 | 1,420 19 | 702 -2 | 718 21 | 67 9 | 40 5 | 27 4 |
| 2016-17 | 1,472 -15 | 1,414 -6 | 659 -43 | 755 37 | 58 -9 | 30 -10 | 28 1 |
| 2017-18 | 1,453 -19 | 1,391 -23 | 624 -35 | 767 12 | 62 4 | 29 -1 | 33 5 |
| 2018-19 | 1,485 32 | 1,417 26 | 589 -35 | 828 61 | 68 6 | 38 9 | 30 -3 |
| 2019-20 | 1,533 48 | 1,480 63 | 592 3 | 888 60 | 53 -15 | 28 -10 | 25 -5 |
| 2020-21 | 1,512 -21 | 1,462 -18 | 569 -23 | 893 5 | 50 -3 | 21 -7 | 29 4 |
| 2021-22 | 1,620 108 | 1,558 96 | 583 14 | 975 82 | 62 12 | 33 12 | 29 0 |
| 2022-23 | 1,517 -103 | 1,451 -107 | 507 -76 | 944 -31 | 66 4 | 41 8 | 25 -4 |
| Average | 1,488 | 1,428 | 628 | 800 | 60 | 34 | 26 |