Student Population by Gender
College for Creative Studies has a total of 1,517 enrolled students for the academic year 2022-2023. 1,451 students have enrolled in undergraduate programs and 66 students joined graduate programs.
By gender, 548 male and 969 female students (the male-female ratio is 36:64) are attending the school. The gender distribution is based on the 2022-2023 data.
| Total | Undergraduate | Graduate | |
|---|---|---|---|
| Total | 1,517 | 1,451 | 66 |
| Men | 548 | 507 | 41 |
| Women | 969 | 944 | 25 |
Student Distribution by Race/Ethnicity
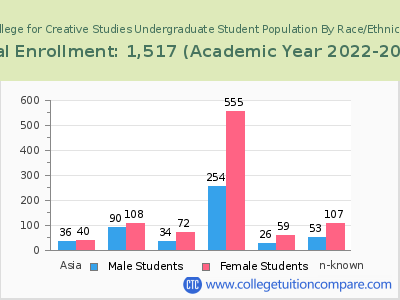
| Race | Total | Men | Women |
|---|---|---|---|
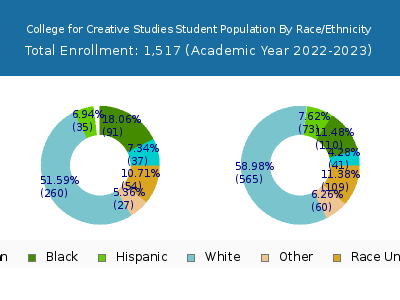
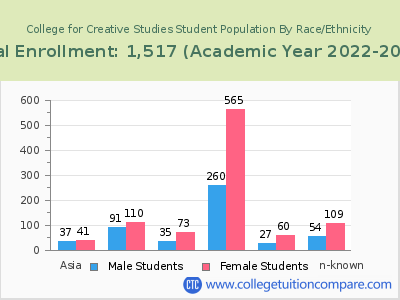
| American Indian or Native American | 3 | 1 | 2 |
| Asian | 72 | 28 | 44 |
| Black | 190 | 75 | 115 |
| Hispanic | 89 | 36 | 53 |
| Native Hawaiian or Other Pacific Islanders | 4 | 3 | 1 |
| White | 785 | 236 | 549 |
| Two or more races | 92 | 28 | 64 |
| Race Unknown | 135 | 43 | 92 |
| Race | Total | Men | Women |
|---|---|---|---|
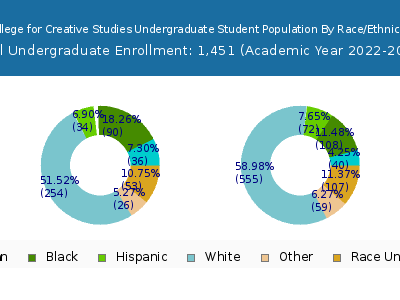
| American Indian or Native American | 3 | 1 | 2 |
| Asian | 71 | 28 | 43 |
| Black | 189 | 74 | 115 |
| Hispanic | 89 | 36 | 53 |
| Native Hawaiian or Other Pacific Islanders | 4 | 3 | 1 |
| White | 773 | 232 | 541 |
| Two or more races | 89 | 26 | 63 |
| Race Unknown | 132 | 42 | 90 |
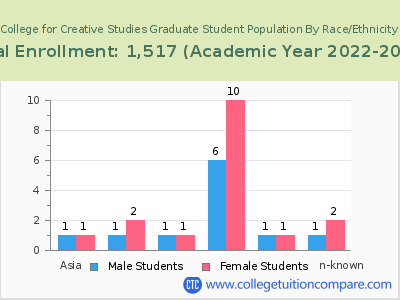
| Race | Total | Men | Women |
|---|---|---|---|
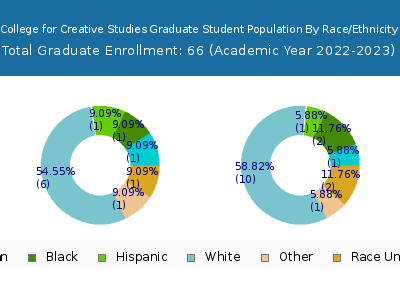
| American Indian or Native American | 1 | 1 | 0 |
| Asian | 5 | 3 | 2 |
| Black | 16 | 4 | 12 |
| Hispanic | 3 | 1 | 2 |
| Native Hawaiian or Other Pacific Islanders | 0 | 0 | 0 |
| White | 40 | 8 | 32 |
| Two or more races | 4 | 0 | 4 |
| Race Unknown | 11 | 6 | 5 |
Student Age Distribution
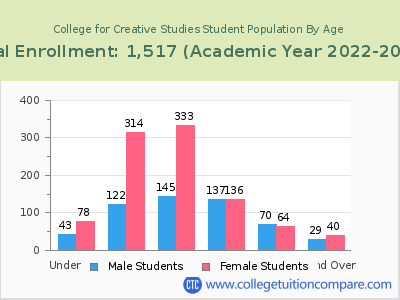
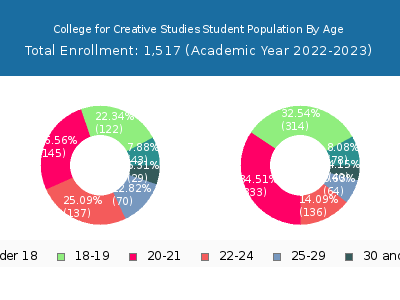
| Age | Total | Men | Women |
|---|---|---|---|
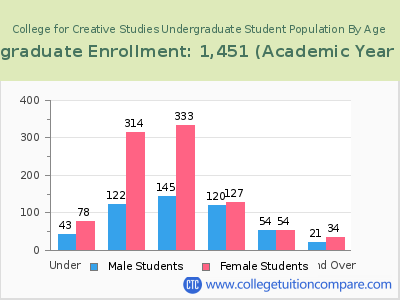
| Under 18 | 121 | 78 | 43 |
| 18-19 | 436 | 314 | 122 |
| 20-21 | 478 | 333 | 145 |
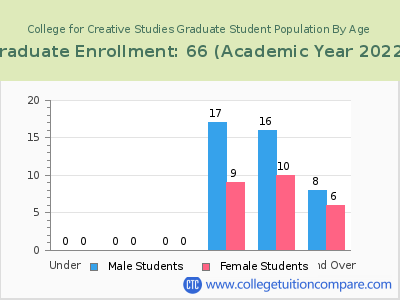
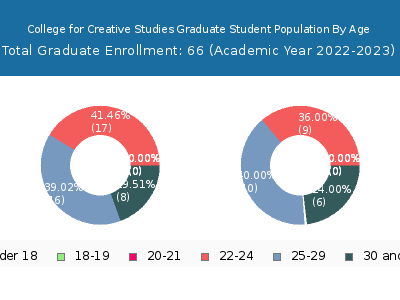
| 22-24 | 273 | 136 | 137 |
| 25-29 | 134 | 64 | 70 |
| 30-34 | 38 | 19 | 19 |
| 35-39 | 12 | 7 | 5 |
| 40-49 | 12 | 7 | 5 |
| 50-64 | 7 | 7 | 0 |
| Age | Total | Men | Women |
|---|---|---|---|
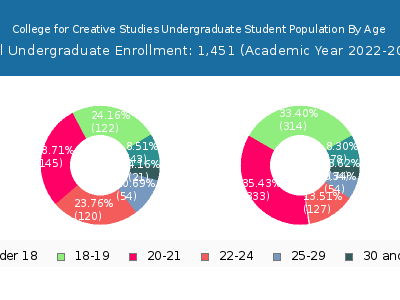
| Under 18 | 121 | 78 | 43 |
| 18-19 | 436 | 314 | 122 |
| 20-21 | 478 | 333 | 145 |
| 22-24 | 247 | 127 | 120 |
| 25-29 | 108 | 54 | 54 |
| 30-34 | 27 | 15 | 12 |
| 35-39 | 9 | 5 | 4 |
| 40-49 | 12 | 7 | 5 |
| 50-64 | 7 | 7 | 0 |
| Age | Total | Men | Women |
|---|
Online Student Enrollment
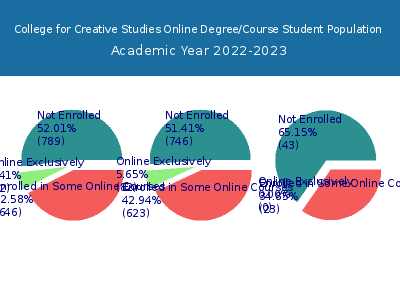
Distance learning, also called online education, is very attractive to students, especially who want to continue education and work in field. At College for Creative Studies, 82 students are enrolled exclusively in online courses and 646 students are enrolled in some online courses.
45 students lived in Michigan or jurisdiction in which the school is located are enrolled exclusively in online courses and 37 students live in other State or outside of the United States.
| All Students | Enrolled Exclusively Online Courses | Enrolled in Some Online Courses | |
|---|---|---|---|
| All Students | 1,517 | 82 | 646 |
| Undergraduate | 1,451 | 82 | 623 |
| Graduate | 66 | 0 | 23 |
| Michigan Residents | Other States in U.S. | Outside of U.S. | |
|---|---|---|---|
| All Students | 45 | 37 | 0 |
| Undergraduate | 45 | 37 | 0 |
| Graduate | 0 | - | 0 |
Transfer-in Students (Undergraduate)
Among 1,451 enrolled in undergraduate programs, 85 students have transferred-in from other institutions. The percentage of transfer-in students is 5.86%.72 students have transferred in as full-time status and 13 students transferred in as part-time status.
| Number of Students | |
|---|---|
| Regular Full-time | 1,068 |
| Transfer-in Full-time | 72 |
| Regular Part-time | 298 |
| Transfer-in Part-time | 13 |
