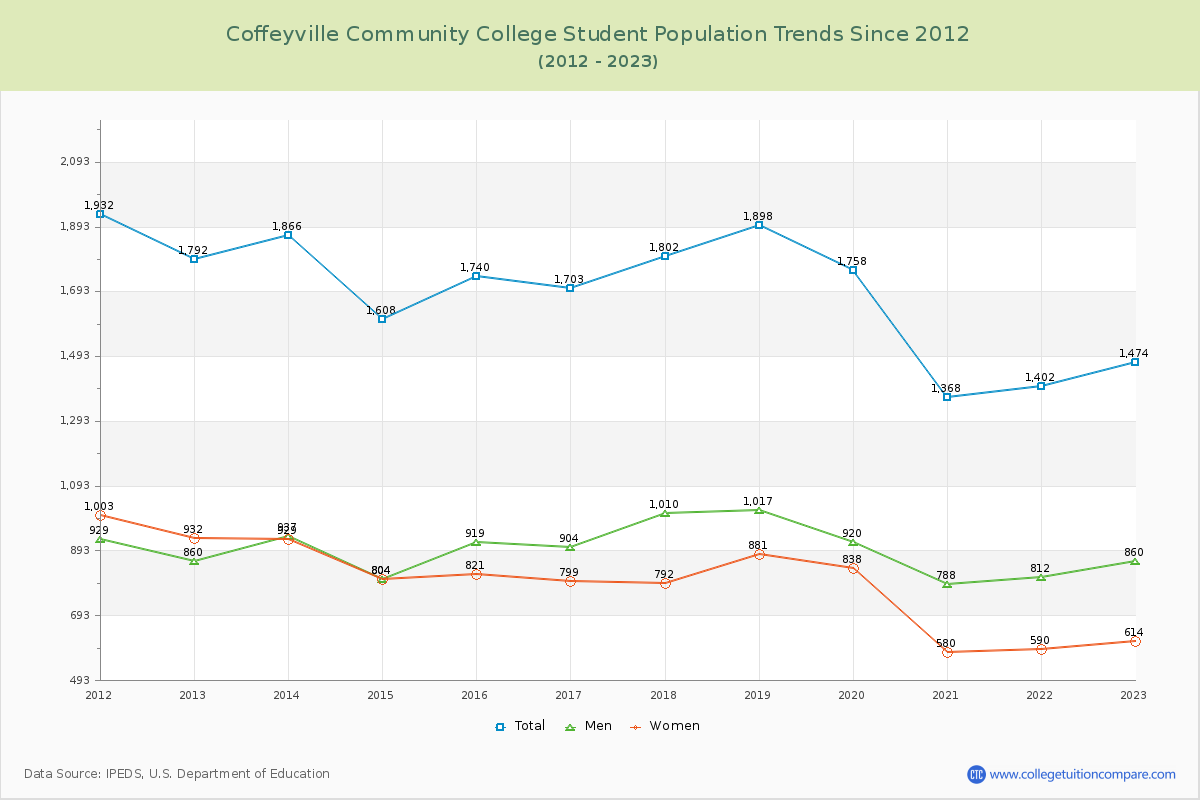
Student Population Changes
The average student population over the last 12 years is 1,674 where 1,474 students are attending the school for the academic year 2022-2023.
The female to male ratio is 0.71 to 1 and it means that there are more male students enrolled in Coffeyville CC than female students.
The following table and chart illustrate the changes in student population by gender at Coffeyville Community College since 2012.
| Year | Total | Men | Women |
|---|---|---|---|
| 2012-13 | 1,792 | 860 | 932 |
| 2013-14 | 1,866 74 | 937 77 | 929 -3 |
| 2014-15 | 1,608 -258 | 804 -133 | 804 -125 |
| 2015-16 | 1,740 132 | 919 115 | 821 17 |
| 2016-17 | 1,703 -37 | 904 -15 | 799 -22 |
| 2017-18 | 1,802 99 | 1,010 106 | 792 -7 |
| 2018-19 | 1,898 96 | 1,017 7 | 881 89 |
| 2019-20 | 1,758 -140 | 920 -97 | 838 -43 |
| 2020-21 | 1,368 -390 | 788 -132 | 580 -258 |
| 2021-22 | 1,402 34 | 812 24 | 590 10 |
| 2022-23 | 1,474 72 | 860 48 | 614 24 |
| Average | 1,674 | 894 | 780 |