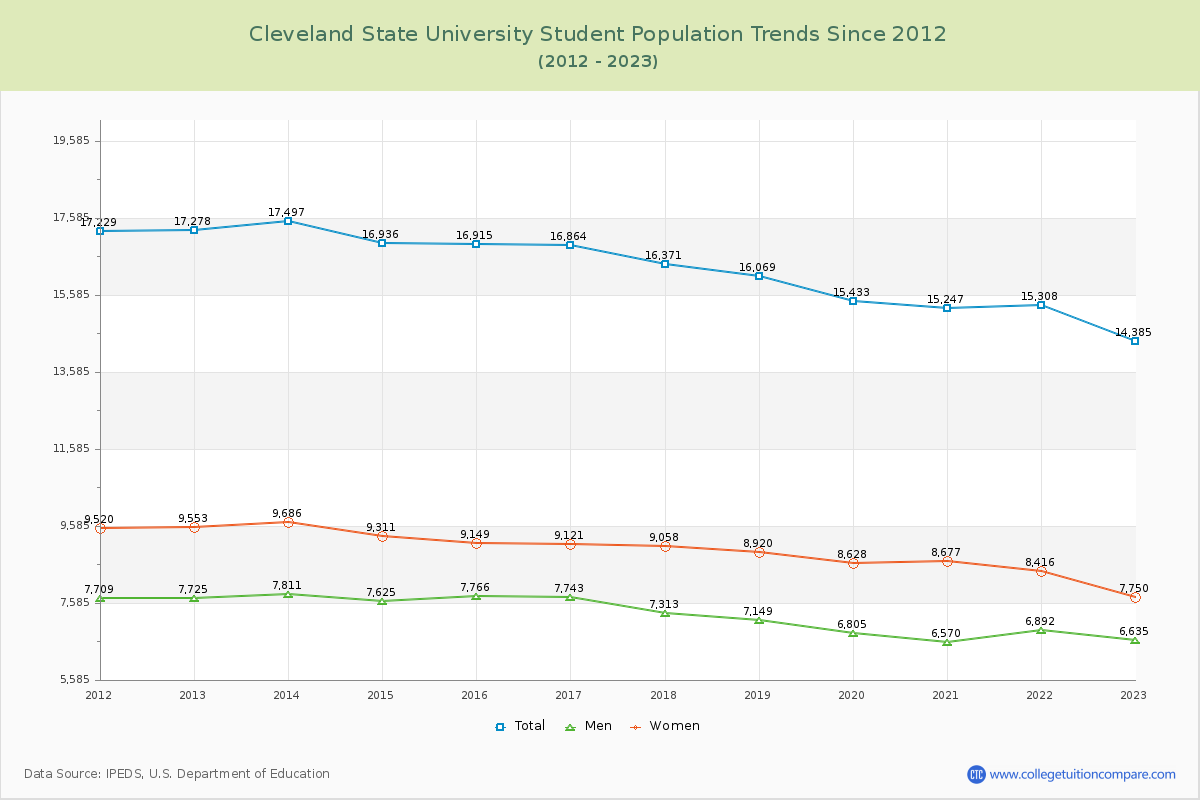
Student Population Changes
The average student population over the last 12 years is 16,209 where 14,385 students are attending the school for the academic year 2022-2023.
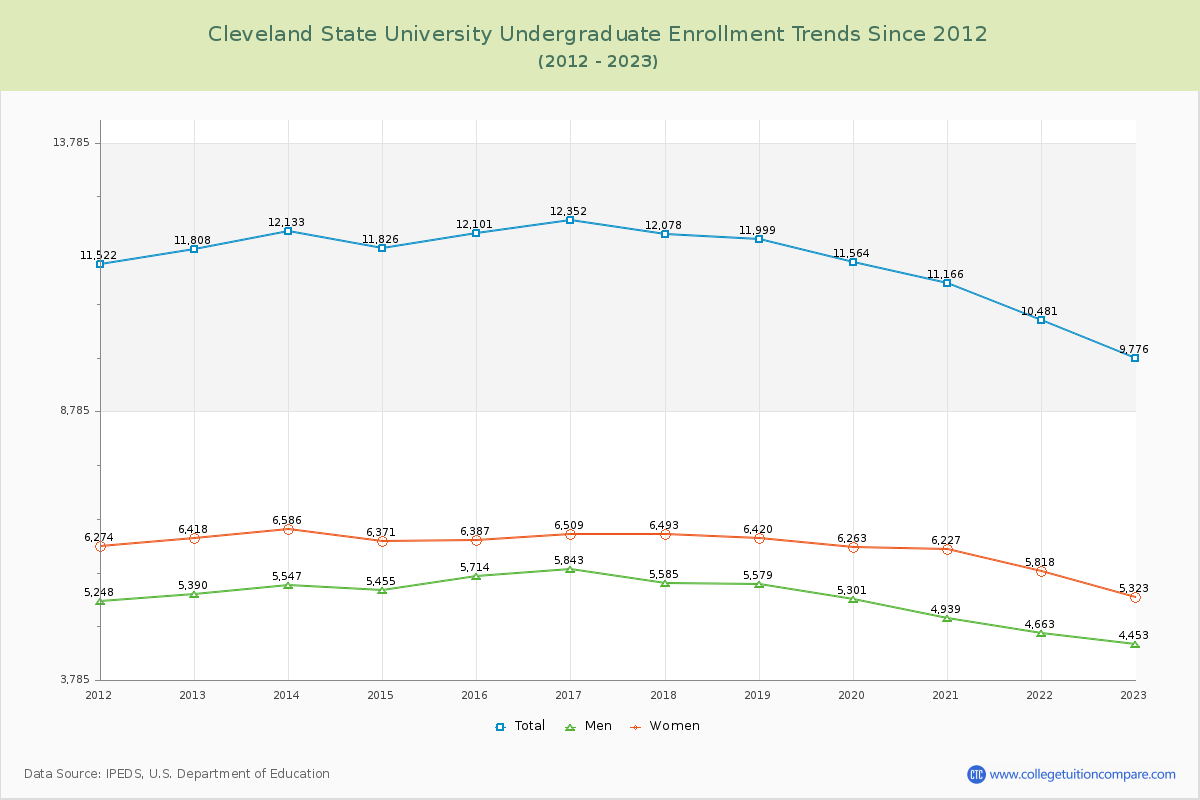
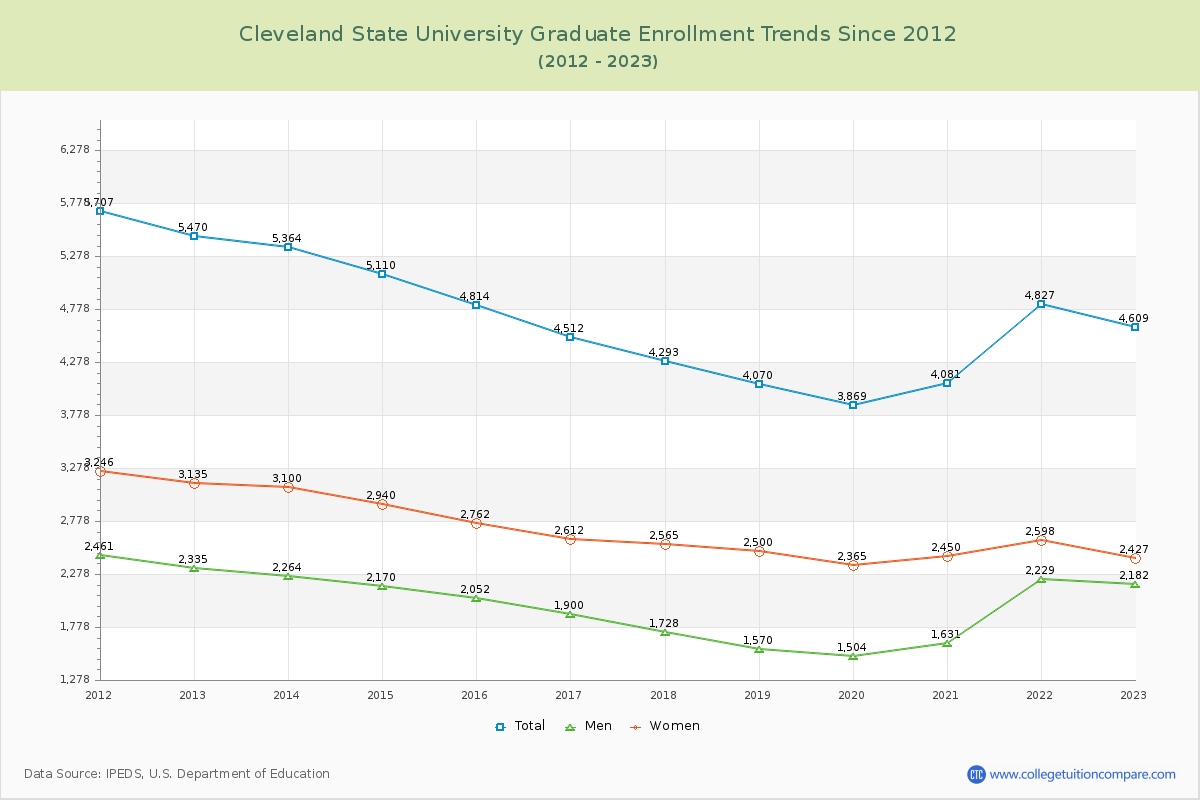
67.96% of total students is undergraduate students and 32.04% students is graduate students. The number of undergraduate students has decreased by 2,032 and the graduate enrollment has decreased by 861 over past 10 years.
The female to male ratio is 1.17 to 1 and it means that there are slightly more female students enrolled in Cleveland State than male students.
The following table and chart illustrate the changes in student population by gender at Cleveland State University since 2012.
| Year | Total | Undergraduate | Graduate | ||||
|---|---|---|---|---|---|---|---|
| Total | Men | Women | Total | Men | Women | ||
| 2012-13 | 17,278 | 11,808 | 5,390 | 6,418 | 5,470 | 2,335 | 3,135 |
| 2013-14 | 17,497 219 | 12,133 325 | 5,547 157 | 6,586 168 | 5,364 -106 | 2,264 -71 | 3,100 -35 |
| 2014-15 | 16,936 -561 | 11,826 -307 | 5,455 -92 | 6,371 -215 | 5,110 -254 | 2,170 -94 | 2,940 -160 |
| 2015-16 | 16,915 -21 | 12,101 275 | 5,714 259 | 6,387 16 | 4,814 -296 | 2,052 -118 | 2,762 -178 |
| 2016-17 | 16,864 -51 | 12,352 251 | 5,843 129 | 6,509 122 | 4,512 -302 | 1,900 -152 | 2,612 -150 |
| 2017-18 | 16,371 -493 | 12,078 -274 | 5,585 -258 | 6,493 -16 | 4,293 -219 | 1,728 -172 | 2,565 -47 |
| 2018-19 | 16,069 -302 | 11,999 -79 | 5,579 -6 | 6,420 -73 | 4,070 -223 | 1,570 -158 | 2,500 -65 |
| 2019-20 | 15,433 -636 | 11,564 -435 | 5,301 -278 | 6,263 -157 | 3,869 -201 | 1,504 -66 | 2,365 -135 |
| 2020-21 | 15,247 -186 | 11,166 -398 | 4,939 -362 | 6,227 -36 | 4,081 212 | 1,631 127 | 2,450 85 |
| 2021-22 | 15,308 61 | 10,481 -685 | 4,663 -276 | 5,818 -409 | 4,827 746 | 2,229 598 | 2,598 148 |
| 2022-23 | 14,385 -923 | 9,776 -705 | 4,453 -210 | 5,323 -495 | 4,609 -218 | 2,182 -47 | 2,427 -171 |
| Average | 16,209 | 11,571 | 5,315 | 6,256 | 4,638 | 1,960 | 2,678 |