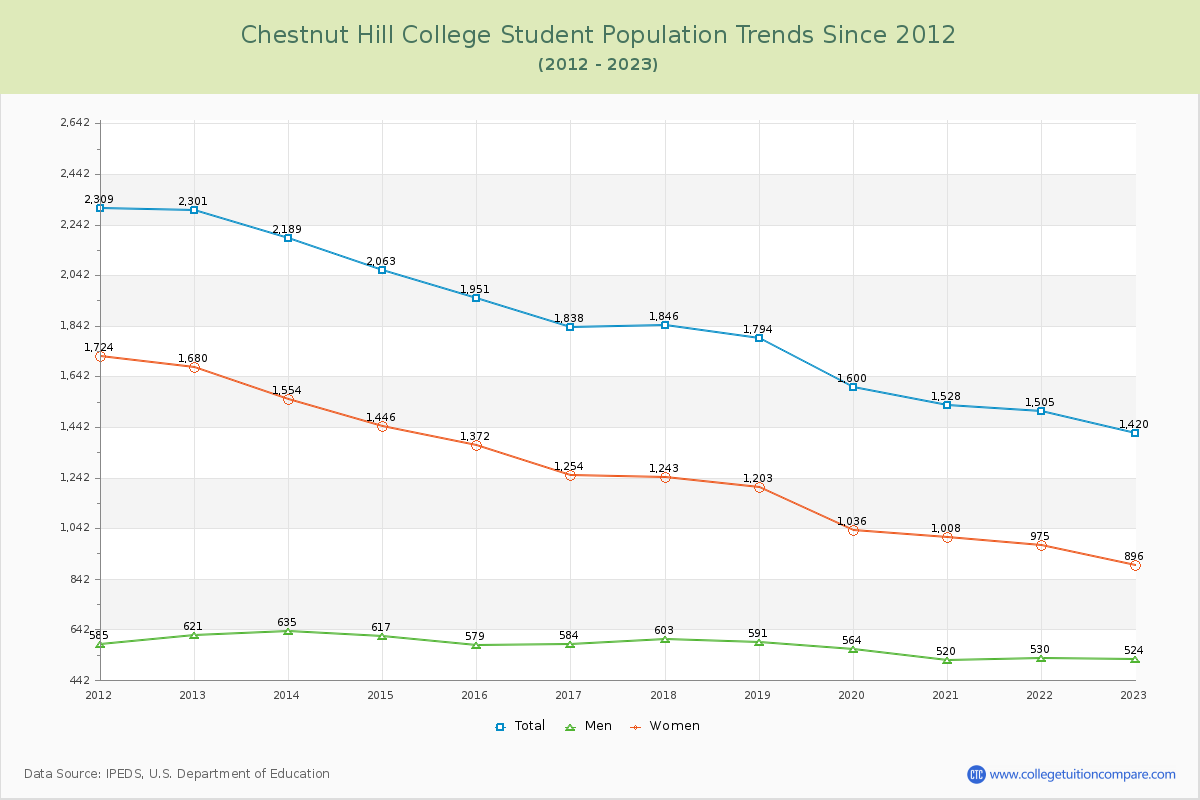
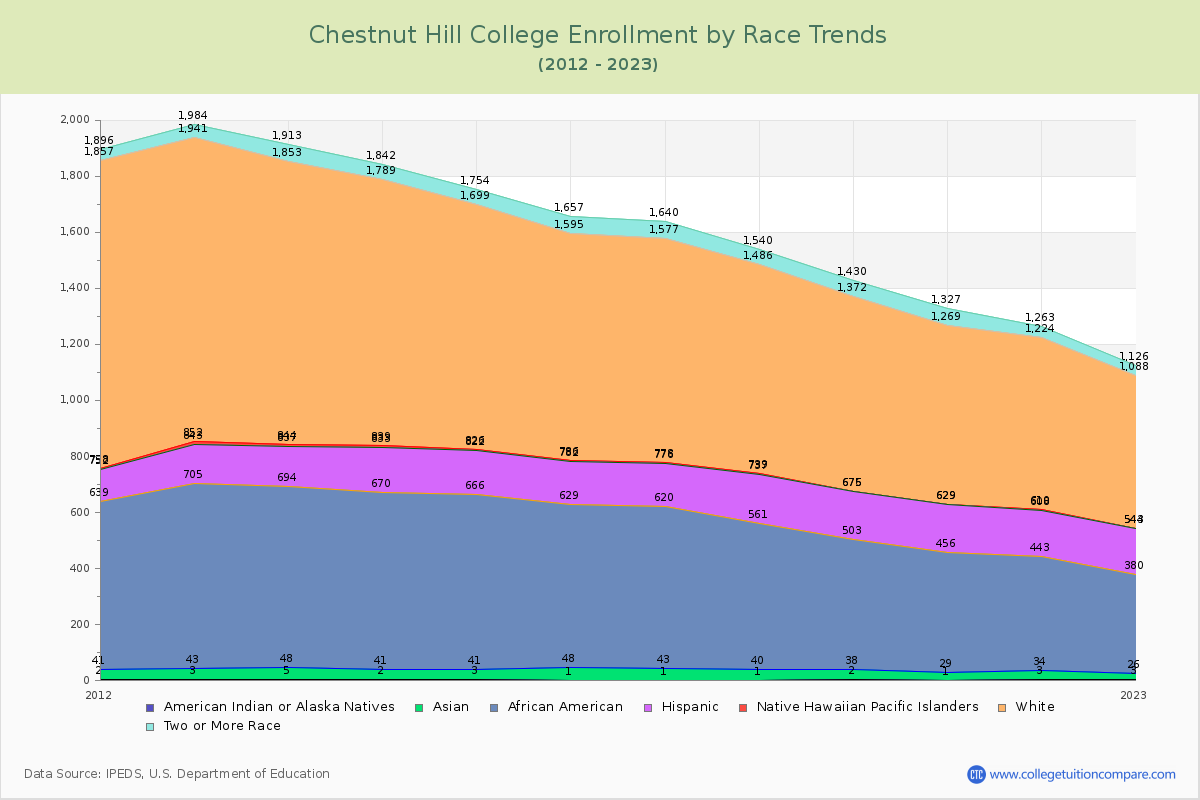
Student Population Changes
The average student population over the last 12 years is 1,821 where 1,420 students are attending the school for the academic year 2022-2023.
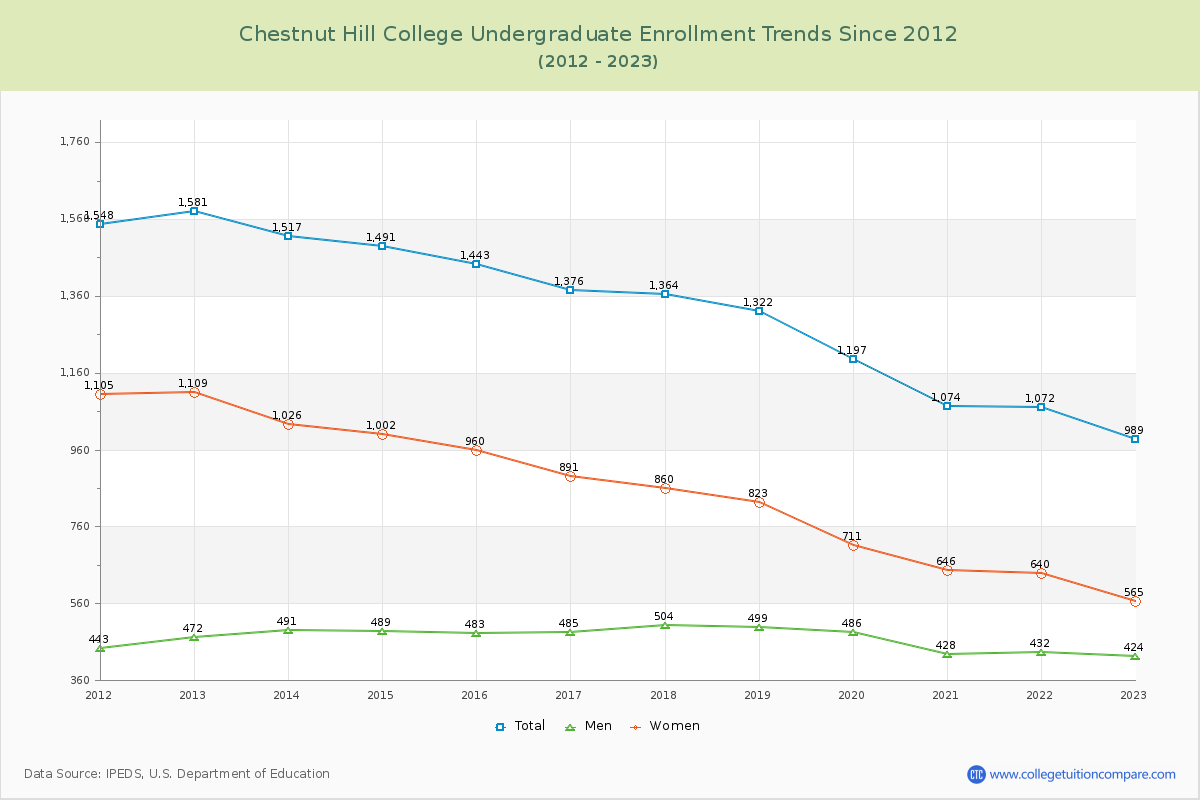
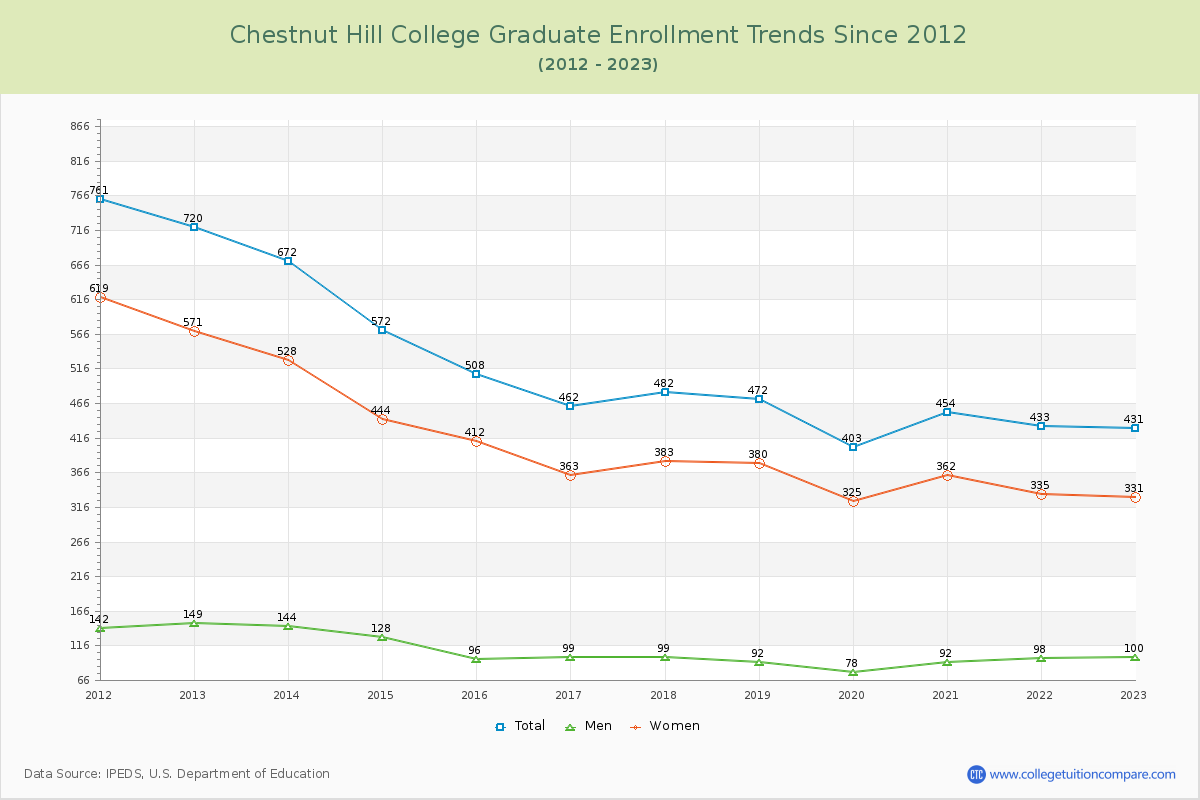
69.65% of total students is undergraduate students and 30.35% students is graduate students. The number of undergraduate students has decreased by 592 and the graduate enrollment has decreased by 289 over past 10 years.
The female to male ratio is 1.71 to 1 and it means that there are more female students enrolled in CHC than male students.
The following table and chart illustrate the changes in student population by gender at Chestnut Hill College since 2012.
| Year | Total | Undergraduate | Graduate | ||||
|---|---|---|---|---|---|---|---|
| Total | Men | Women | Total | Men | Women | ||
| 2012-13 | 2,301 | 1,581 | 472 | 1,109 | 720 | 149 | 571 |
| 2013-14 | 2,189 -112 | 1,517 -64 | 491 19 | 1,026 -83 | 672 -48 | 144 -5 | 528 -43 |
| 2014-15 | 2,063 -126 | 1,491 -26 | 489 -2 | 1,002 -24 | 572 -100 | 128 -16 | 444 -84 |
| 2015-16 | 1,951 -112 | 1,443 -48 | 483 -6 | 960 -42 | 508 -64 | 96 -32 | 412 -32 |
| 2016-17 | 1,838 -113 | 1,376 -67 | 485 2 | 891 -69 | 462 -46 | 99 3 | 363 -49 |
| 2017-18 | 1,846 8 | 1,364 -12 | 504 19 | 860 -31 | 482 20 | 99 0 | 383 20 |
| 2018-19 | 1,794 -52 | 1,322 -42 | 499 -5 | 823 -37 | 472 -10 | 92 -7 | 380 -3 |
| 2019-20 | 1,600 -194 | 1,197 -125 | 486 -13 | 711 -112 | 403 -69 | 78 -14 | 325 -55 |
| 2020-21 | 1,528 -72 | 1,074 -123 | 428 -58 | 646 -65 | 454 51 | 92 14 | 362 37 |
| 2021-22 | 1,505 -23 | 1,072 -2 | 432 4 | 640 -6 | 433 -21 | 98 6 | 335 -27 |
| 2022-23 | 1,420 -85 | 989 -83 | 424 -8 | 565 -75 | 431 -2 | 100 2 | 331 -4 |
| Average | 1,821 | 1,311 | 472 | 839 | 510 | 107 | 403 |