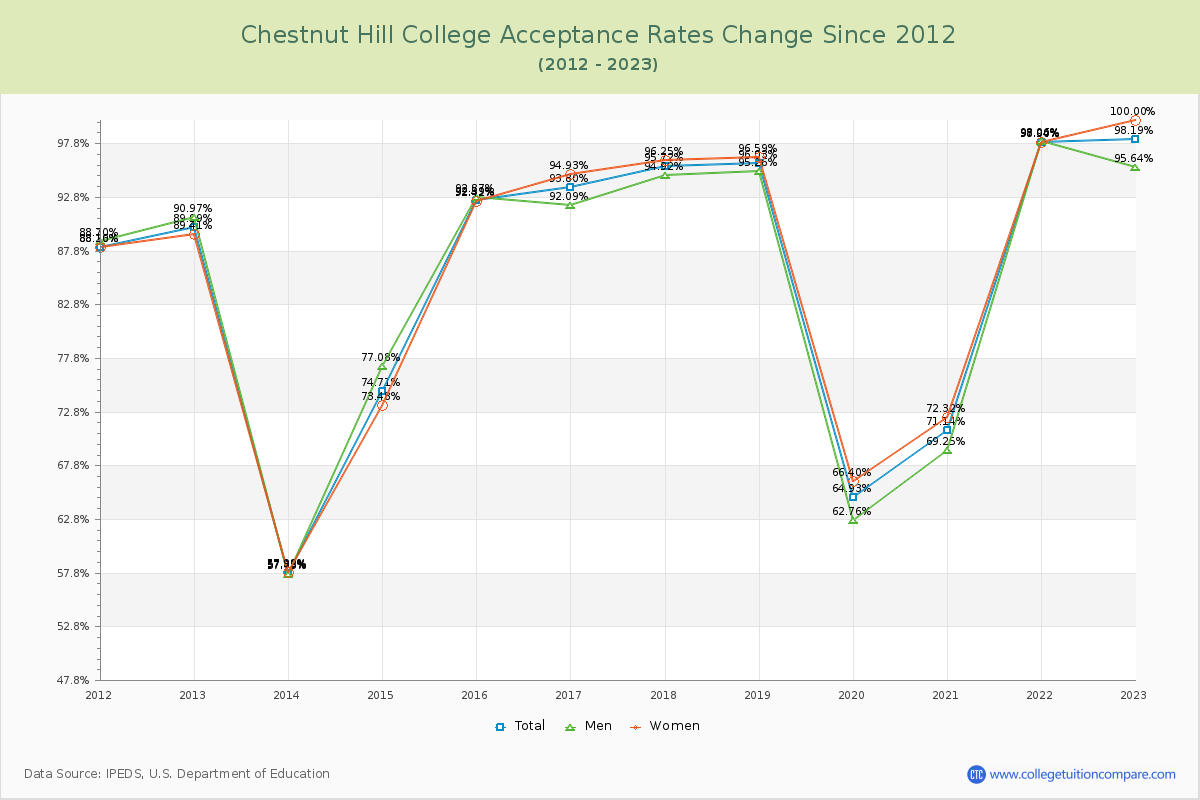
Acceptance Rate Changes
The average acceptance rate over the last 10 years is 84.81%, and this year's acceptance rate is 98.19% at Chestnut Hill College. By gender, men students' acceptance rate is 84.24% and women students' rate is 85.24%.
The next table and chart illustrate the acceptance rates changes at Chestnut Hill College over the past 11 years (2012-2023).
| Year | Total | Men | Women |
|---|---|---|---|
| 2012-13 | 89.99% | 90.97% | 89.41% |
| 2013-14 | 57.85% -32.15% |
57.73% -31.49% |
57.92% -31.49% |
| 2014-15 | 74.71% 16.87% |
77.08% 15.56% |
73.48% 15.56% |
| 2015-16 | 92.59% 17.88% |
92.87% 18.94% |
92.42% 18.94% |
| 2016-17 | 93.80% 1.21% |
92.09% 2.51% |
94.93% 2.51% |
| 2017-18 | 95.72% 1.92% |
94.92% 1.33% |
96.25% 1.33% |
| 2018-19 | 96.03% 0.31% |
95.26% 0.33% |
96.59% 0.33% |
| 2019-20 | 64.93% -31.10% |
62.76% -30.19% |
66.40% -30.19% |
| 2020-21 | 71.14% 6.21% |
69.25% 5.92% |
72.32% 5.92% |
| 2021-22 | 98.00% 26.86% |
98.06% 25.62% |
97.94% 25.62% |
| 2022-23 | 98.19% 0.19% |
95.64% 2.06% |
100.00% 2.06% |
| Average | 84.81% | 84.24% | 85.24% |