Student Population Changes
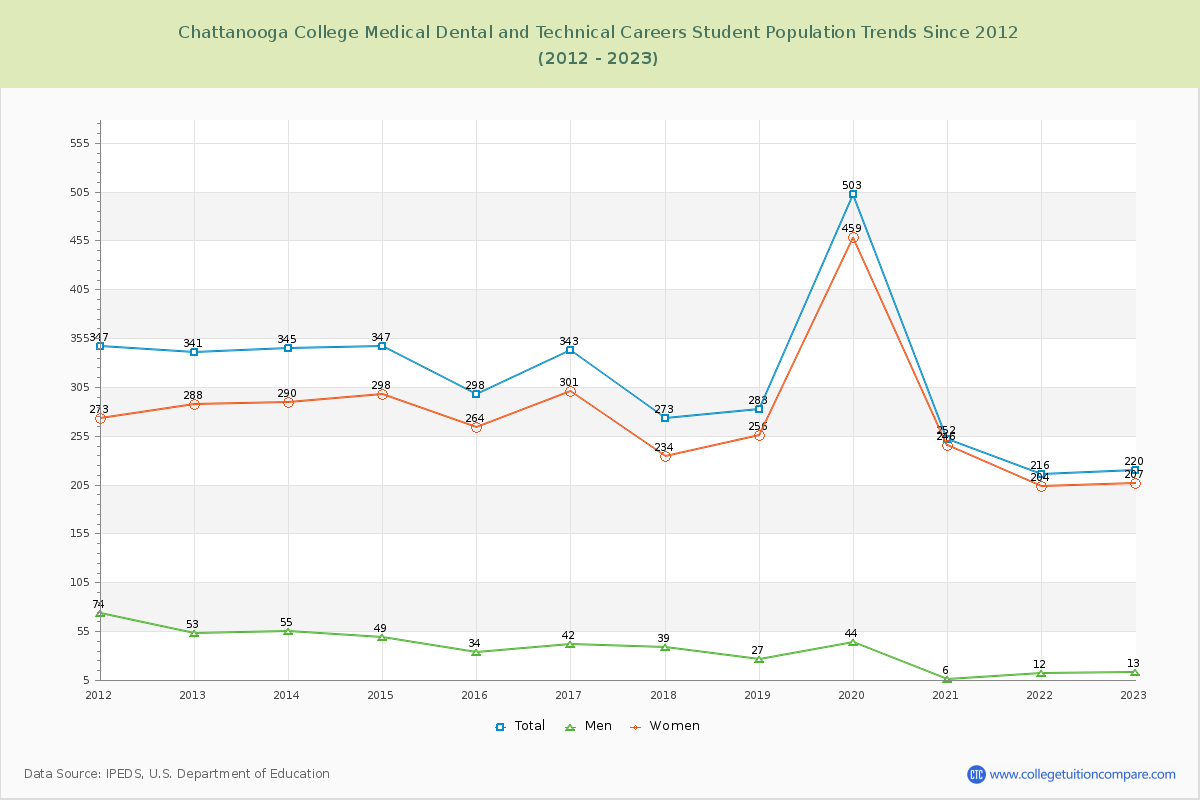
The average student population over the last 12 years is 311 where 220 students are attending the school for the academic year 2022-2023.
The female to male ratio is 15.92 to 1 and it means that there are far more female students enrolled in Chattanooga College Medical Dental and Technical Careers than male students.
The following table and chart illustrate the changes in student population by gender at Chattanooga College Medical Dental and Technical Careers since 2012.
| Year | Total | Men | Women |
|---|---|---|---|
| 2012-13 | 341 | 53 | 288 |
| 2013-14 | 345 4 | 55 2 | 290 2 |
| 2014-15 | 347 2 | 49 -6 | 298 8 |
| 2015-16 | 298 -49 | 34 -15 | 264 -34 |
| 2016-17 | 343 45 | 42 8 | 301 37 |
| 2017-18 | 273 -70 | 39 -3 | 234 -67 |
| 2018-19 | 283 10 | 27 -12 | 256 22 |
| 2019-20 | 503 220 | 44 17 | 459 203 |
| 2020-21 | 252 -251 | 6 -38 | 246 -213 |
| 2021-22 | 216 -36 | 12 6 | 204 -42 |
| 2022-23 | 220 4 | 13 1 | 207 3 |
| Average | 311 | 34 | 277 |