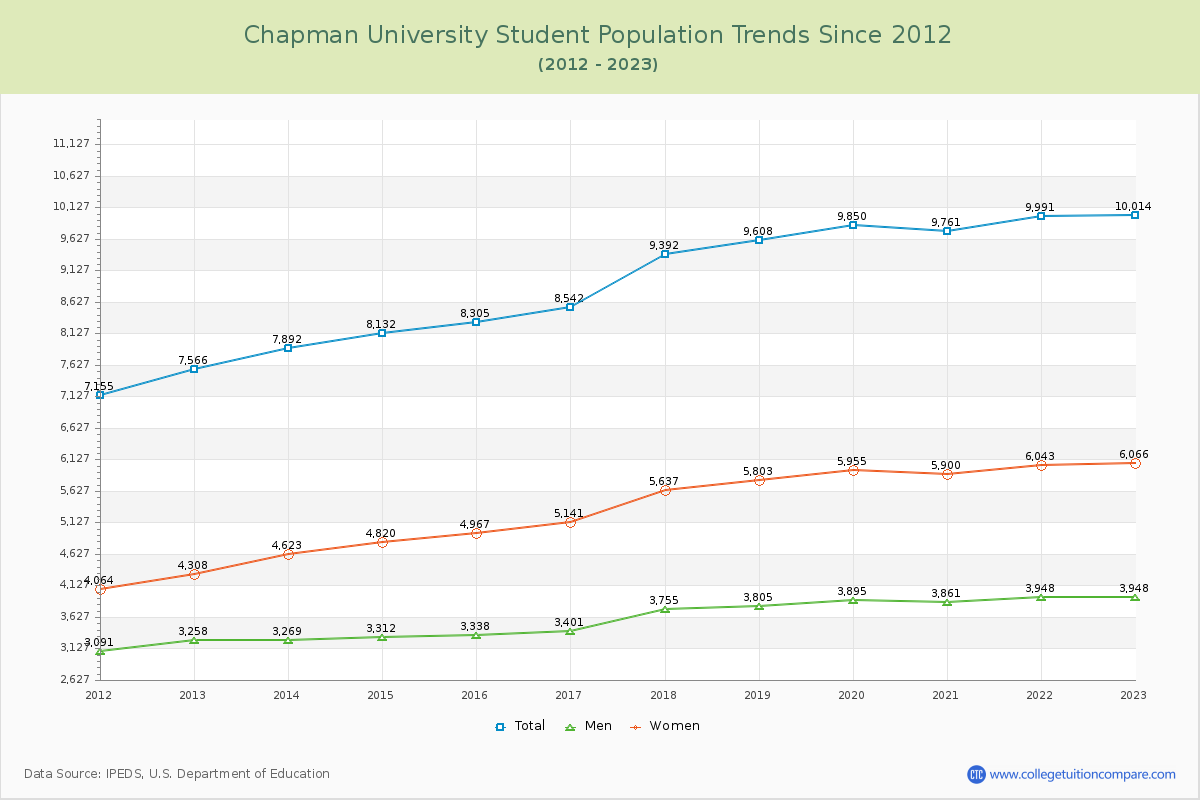
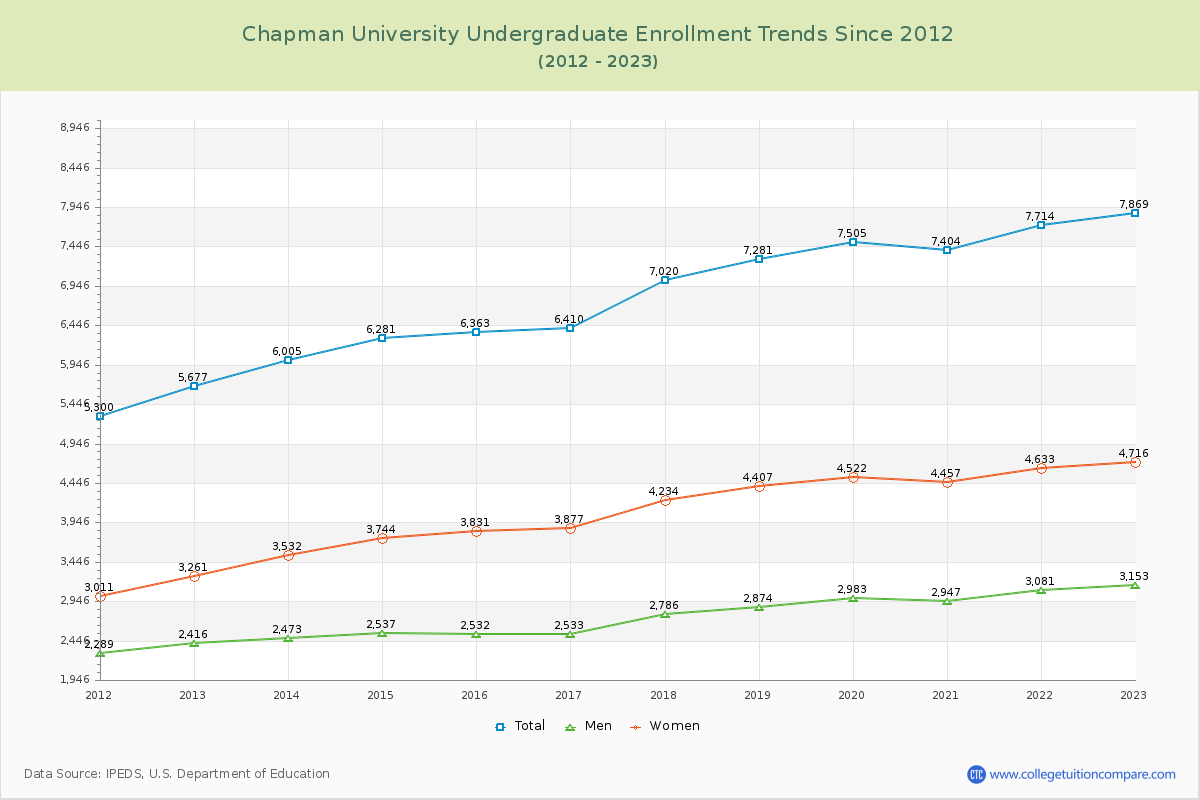
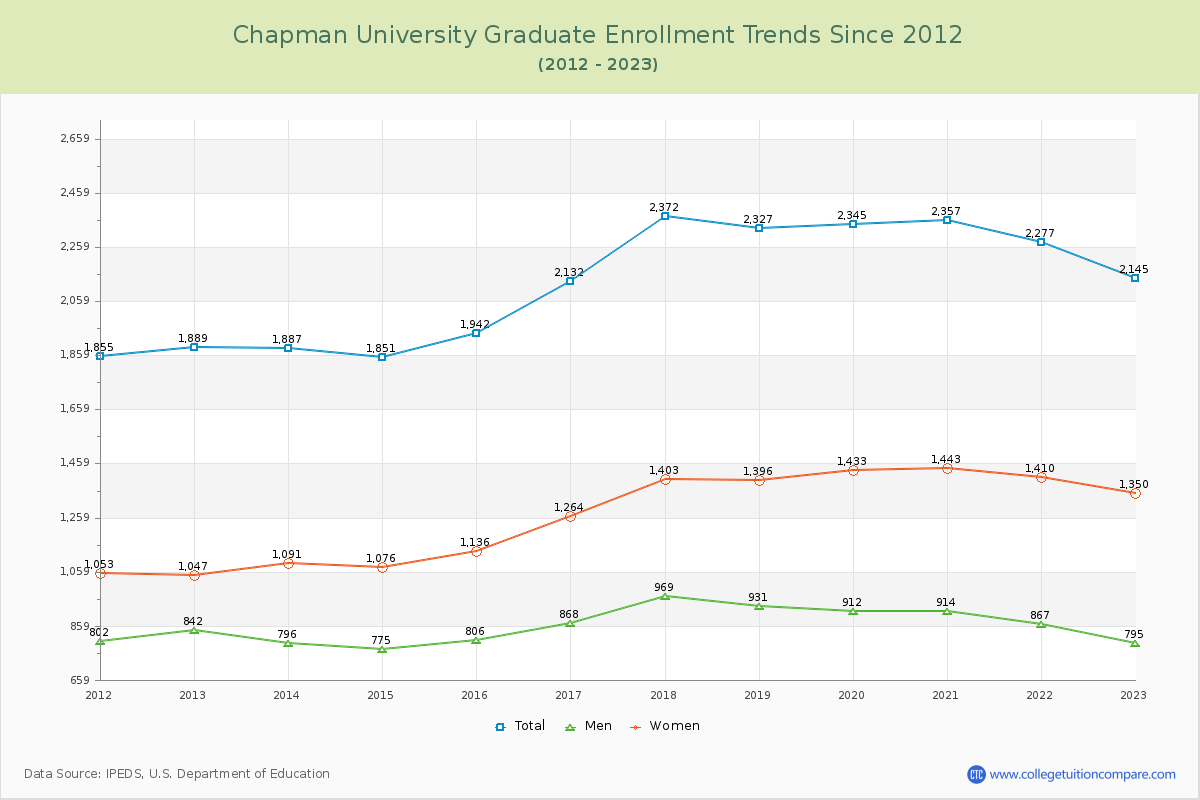
Student Population Changes
The average student population over the last 12 years is 9,005 where 10,014 students are attending the school for the academic year 2022-2023.
78.58% of total students is undergraduate students and 21.42% students is graduate students. The number of undergraduate students has increased by 2,192 and the graduate enrollment has increased by 256 over past 10 years.
The female to male ratio is 1.54 to 1 and it means that there are more female students enrolled in Chapman than male students.
The following table and chart illustrate the changes in student population by gender at Chapman University since 2012.
| Year | Total | Undergraduate | Graduate | ||||
|---|---|---|---|---|---|---|---|
| Total | Men | Women | Total | Men | Women | ||
| 2012-13 | 7,566 | 5,677 | 2,416 | 3,261 | 1,889 | 842 | 1,047 |
| 2013-14 | 7,892 326 | 6,005 328 | 2,473 57 | 3,532 271 | 1,887 -2 | 796 -46 | 1,091 44 |
| 2014-15 | 8,132 240 | 6,281 276 | 2,537 64 | 3,744 212 | 1,851 -36 | 775 -21 | 1,076 -15 |
| 2015-16 | 8,305 173 | 6,363 82 | 2,532 -5 | 3,831 87 | 1,942 91 | 806 31 | 1,136 60 |
| 2016-17 | 8,542 237 | 6,410 47 | 2,533 1 | 3,877 46 | 2,132 190 | 868 62 | 1,264 128 |
| 2017-18 | 9,392 850 | 7,020 610 | 2,786 253 | 4,234 357 | 2,372 240 | 969 101 | 1,403 139 |
| 2018-19 | 9,608 216 | 7,281 261 | 2,874 88 | 4,407 173 | 2,327 -45 | 931 -38 | 1,396 -7 |
| 2019-20 | 9,850 242 | 7,505 224 | 2,983 109 | 4,522 115 | 2,345 18 | 912 -19 | 1,433 37 |
| 2020-21 | 9,761 -89 | 7,404 -101 | 2,947 -36 | 4,457 -65 | 2,357 12 | 914 2 | 1,443 10 |
| 2021-22 | 9,991 230 | 7,714 310 | 3,081 134 | 4,633 176 | 2,277 -80 | 867 -47 | 1,410 -33 |
| 2022-23 | 10,014 23 | 7,869 155 | 3,153 72 | 4,716 83 | 2,145 -132 | 795 -72 | 1,350 -60 |
| Average | 9,005 | 6,866 | 2,756 | 4,110 | 2,139 | 861 | 1,277 |