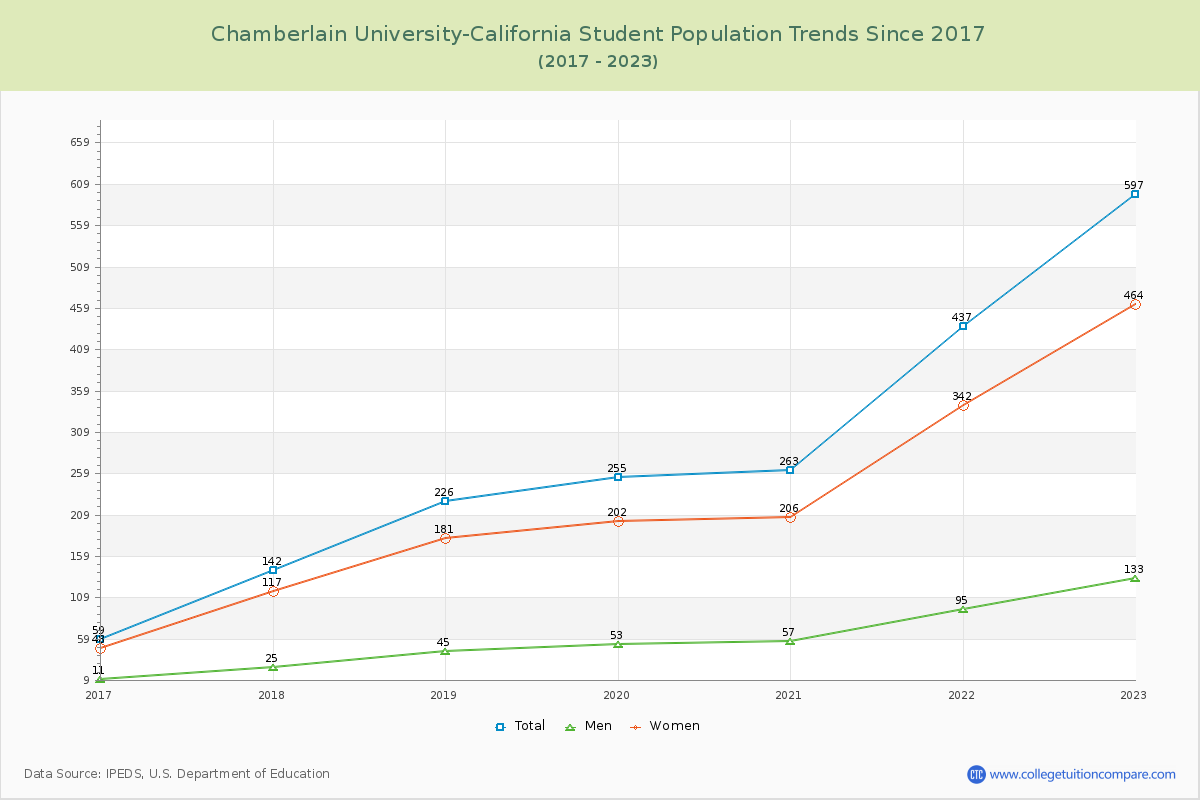
Student Population Changes
The average student population over the last 8 years is 283 where 597 students are attending the school for the academic year 2022-2023.
The female to male ratio is 3.49 to 1 and it means that there are far more female students enrolled in Chamberlain University-California than male students.
The following table and chart illustrate the changes in student population by gender at Chamberlain University-California since 2016.
| Year | Total | Men | Women |
|---|---|---|---|
| 2016-17 | 59 | 11 | 48 |
| 2017-18 | 142 83 | 25 14 | 117 69 |
| 2018-19 | 226 84 | 45 20 | 181 64 |
| 2019-20 | 255 29 | 53 8 | 202 21 |
| 2020-21 | 263 8 | 57 4 | 206 4 |
| 2021-22 | 437 174 | 95 38 | 342 136 |
| 2022-23 | 597 160 | 133 38 | 464 122 |
| Average | 283 | 60 | 223 |