Enrollment Trends at Chamberlain University-Missouri

-277

Total Enrollment

-35

Men

-242

Women

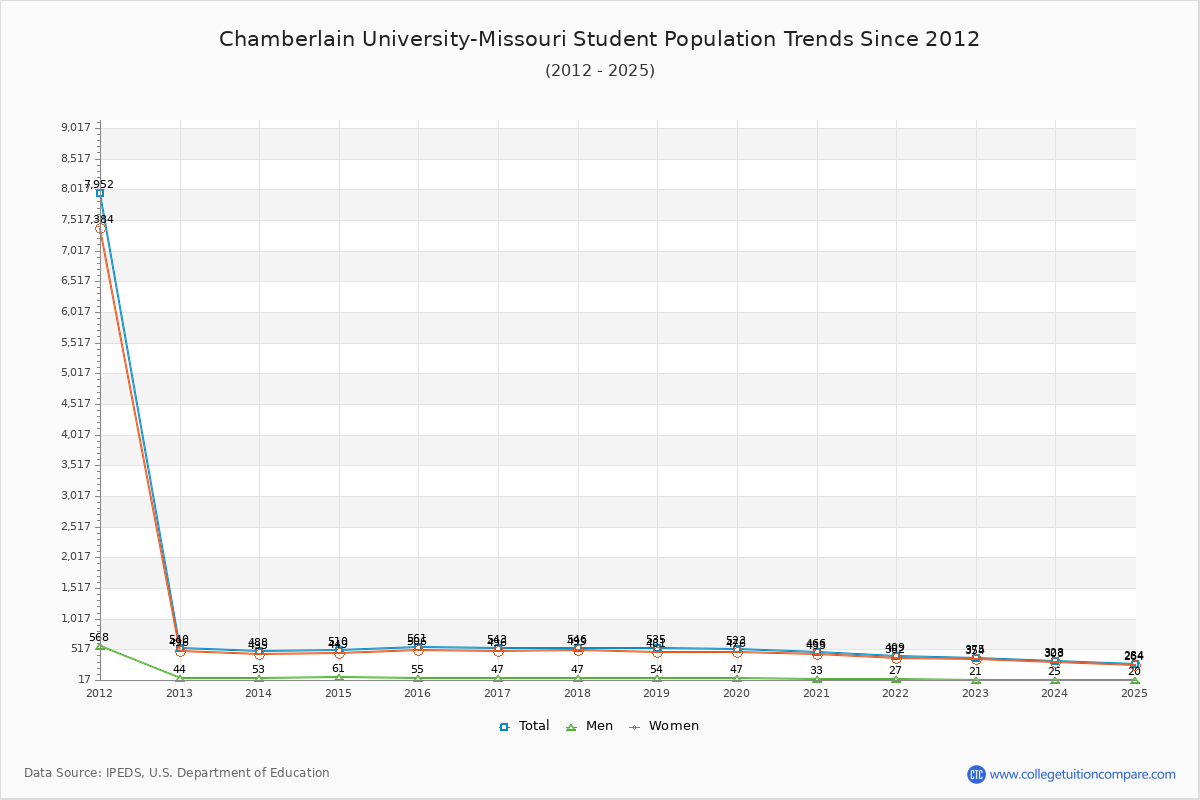
The student population at Chamberlain University-Missouri is 284 (all undergraduate). The number of students has decreased by 277 over the past decade.

The female to male ratio is 13.20 to 1 which means that majority of population is on female students.

10 students enrolled in online degree program exclusively and the number of online students has increased by 11.11% since 2015.

Student Population Changes

The average student population over the last 11 years is 457 where 284 students are attending the school for the academic year 2024-2025.

The female to male ratio is 13.20 to 1 and it means that there are far more female students enrolled in Chamberlain University-Missouri than male students.

The following table and chart illustrate the changes in student population by gender at Chamberlain University-Missouri since 2015.

YearTotalMenWomen
2015-1656155506
2016-17543
-18
47
-8
496
-10
2017-18546
3
47499
3
2018-19535
-11
54
7
481
-18
2019-20523
-12
47
-7
476
-5
2020-21466
-57
33
-14
433
-43
2021-22409
-57
27
-6
382
-51
2022-23375
-34
21
-6
354
-28
2023-24328
-47
25
4
303
-51
2024-25284
-44
20
-5
264
-39
Average45738419
Chamberlain University-Missouri Enrollment Trends Chart

Enrollment by Race/Ethnicity Changes

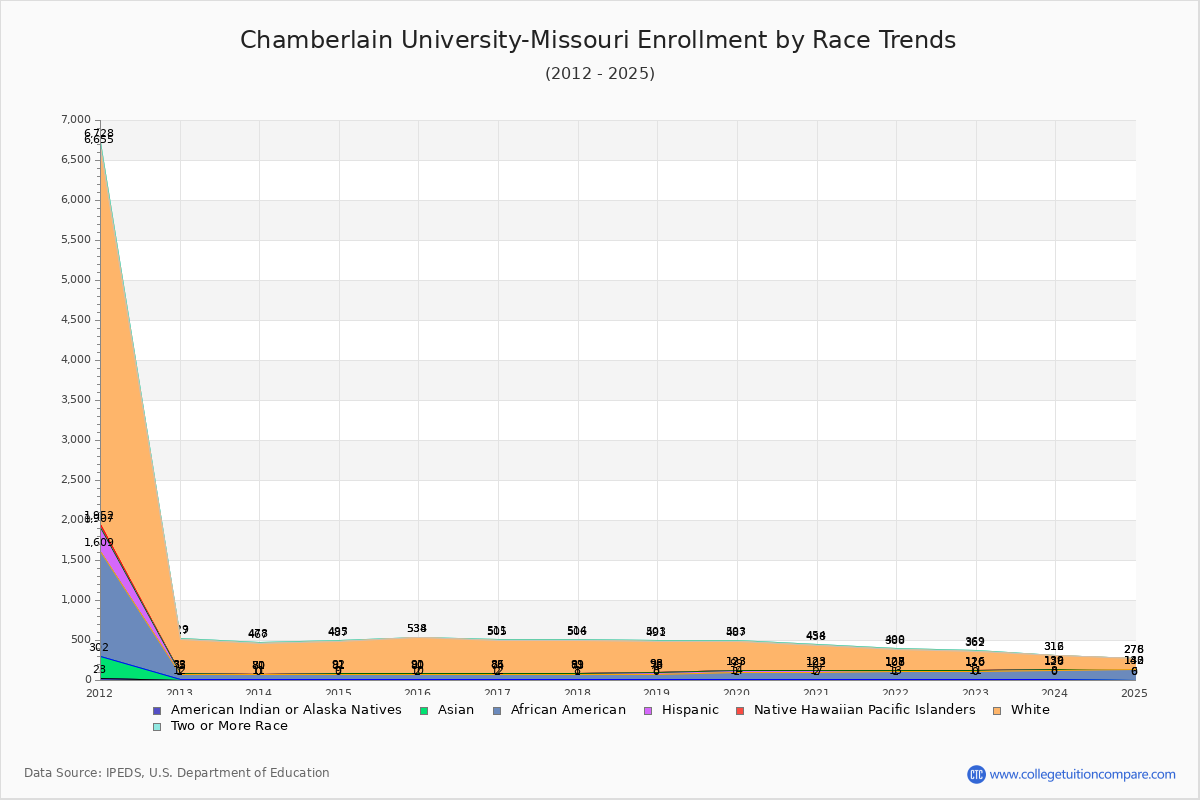
The percentage of white students is 47.18% and the percentage of black students is 44.72% at Chamberlain University-Missouri. 2.11% of enrolled students is Asian. Hispanic students comprise 2.46% of the student body.

Over the past 10 years, the racial composition has shifted. The percentage of white students decreased from 78.97% to 47.18%. Asian enrollment grew from 1.43% to 2.11%. Black student enrollment increased from 12.48% to 44.72%. Hispanic student representation expanded from 1.78% to 2.46%.

The overall racial diversity, measured by the Census Bureau Diversity Index, is 0.5762 which indicates that moderately diverse. This increased from 0.3603 a decade ago, suggesting that racial diversity has improved.

The following table and chart illustrate the student population trends by race/ethnicity at Chamberlain University-Missouri over the past 11 years (2015-2025).

YearAmerican Indian or Native AmericanAsianBlackHispanicNative Hawaiian or Other Pacific IslanderWhiteTwo or More Races
2015-1628701014434
2016-17210621114196
2017-1817651624158
2018-19087020039312
2019-201138524036416
2020-212158521031516
2021-221129519126012
2022-23011991602367
2023-24081181301734
2024-2506127721342
Average110881613159
Chamberlain University-Missouri Enrollment by Race Trends Chart

Distance Learning (Online Courses) Enrollment Changes

10 students are enrolled in online degree programs exclusively for the academic year 2024-2025, which is 4% of total students. The number of online students has increased 11.11% since 2015. The following table and chart illustrate the changes in the online student population by enrolled type at Chamberlain University-Missouri from 2015 to 2025.

YearTotal EnrollmentOnline CompletelyEnrolled in Some Online CoursesNot Enrolled in Online Courses
2015-165619281271
2016-175432217324
2017-185462189355
2018-195355250280
2019-205234269250
2020-2146646600
2021-2240911258140
2022-2337521238116
2023-2432824187117
2024-252841020470
Average45755209192

Ratings & Review

Share your experiences and thoughts about Chamberlain University-Missouri. It will be a great help to applicants and prospective students!