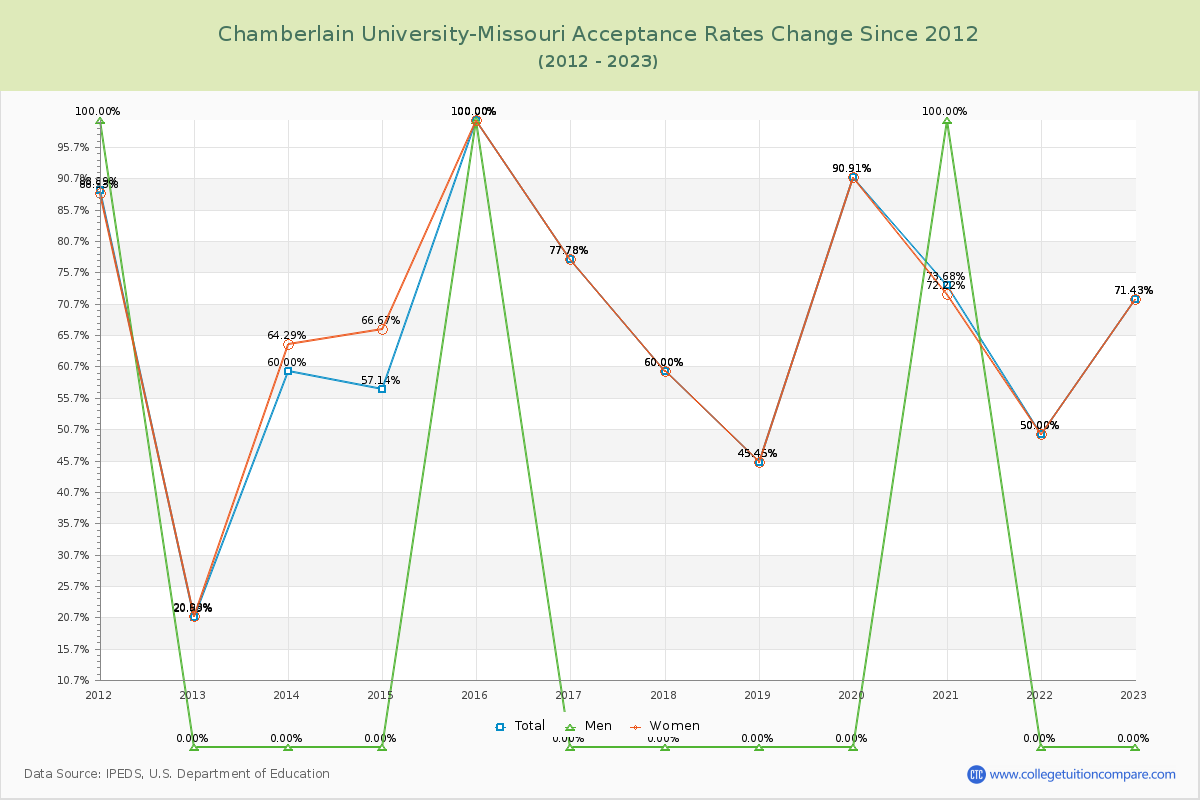
Acceptance Rate Changes
The average acceptance rate over the last 10 years is 64.28%, and this year's acceptance rate is 71.43% at Chamberlain University-Missouri. By gender, men students' acceptance rate is 18.18% and women students' rate is 65.42%. For 2023 admission, it was easier to get into Chamberlain University-Missouri than the previous year.
The next table and chart illustrate the acceptance rates changes at Chamberlain University-Missouri over the past 11 years (2012-2023).
| Year | Total | Men | Women |
|---|---|---|---|
| 2012-13 | 20.69% | 0.00% | 20.93% |
| 2013-14 | 60.00% 39.31% |
0.00% 43.36% |
64.29% 43.36% |
| 2014-15 | 57.14% -2.86% |
0.00% 2.38% |
66.67% 2.38% |
| 2015-16 | 100.00% 42.86% |
100.00% 33.33% |
100.00% 33.33% |
| 2016-17 | 77.78% -22.22% |
0.00% -22.22% |
77.78% -22.22% |
| 2017-18 | 60.00% -17.78% |
0.00% -17.78% |
60.00% -17.78% |
| 2018-19 | 45.45% -14.55% |
0.00% -14.55% |
45.45% -14.55% |
| 2019-20 | 90.91% 45.45% |
0.00% 45.45% |
90.91% 45.45% |
| 2020-21 | 73.68% -17.22% |
100.00% -18.69% |
72.22% -18.69% |
| 2021-22 | 50.00% -23.68% |
0.00% -22.22% |
50.00% -22.22% |
| 2022-23 | 71.43% 21.43% |
0.00% 21.43% |
71.43% 21.43% |
| Average | 64.28% | 18.18% | 65.42% |