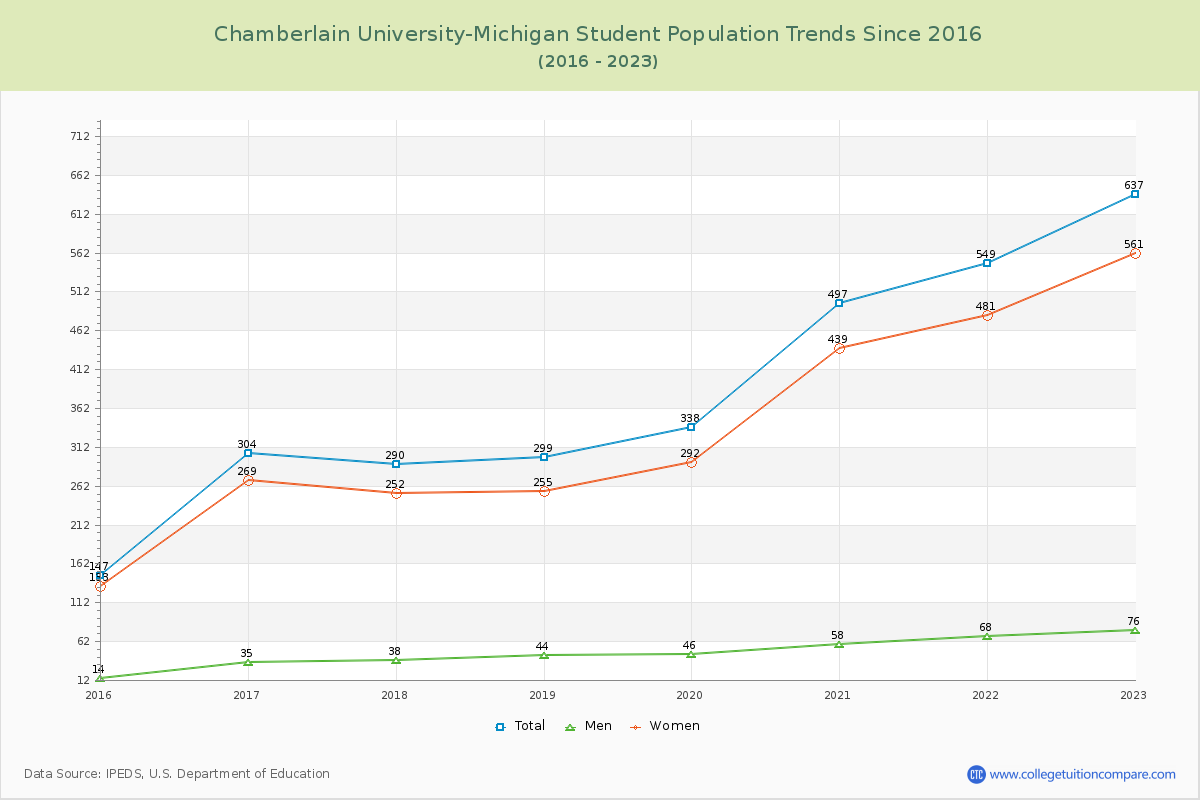
Student Population Changes
The average student population over the last 9 years is 383 where 637 students are attending the school for the academic year 2022-2023.
The female to male ratio is 7.38 to 1 and it means that there are far more female students enrolled in Chamberlain University-Michigan than male students.
The following table and chart illustrate the changes in student population by gender at Chamberlain University-Michigan since 2015.
| Year | Total | Men | Women |
|---|---|---|---|
| 2015-16 | 147 | 14 | 133 |
| 2016-17 | 304 157 | 35 21 | 269 136 |
| 2017-18 | 290 -14 | 38 3 | 252 -17 |
| 2018-19 | 299 9 | 44 6 | 255 3 |
| 2019-20 | 338 39 | 46 2 | 292 37 |
| 2020-21 | 497 159 | 58 12 | 439 147 |
| 2021-22 | 549 52 | 68 10 | 481 42 |
| 2022-23 | 637 88 | 76 8 | 561 80 |
| Average | 383 | 47 | 335 |