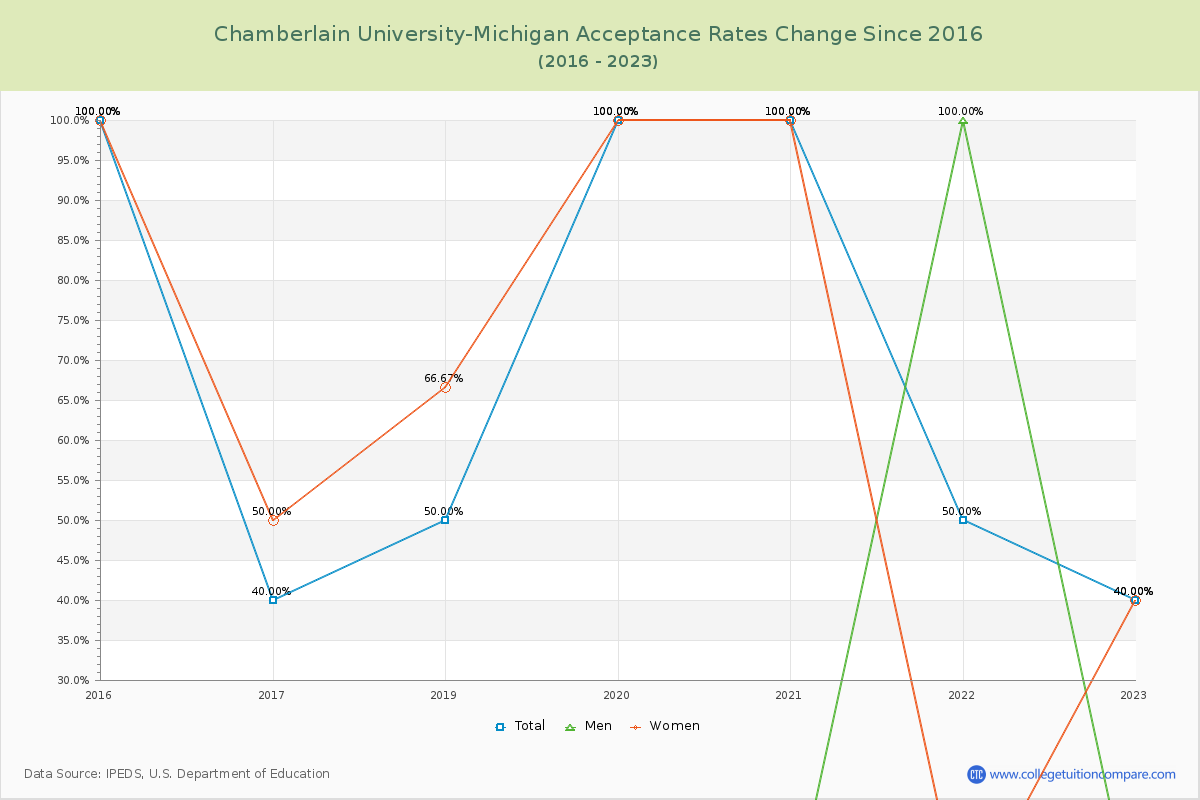
Acceptance Rate Changes
The average acceptance rate over the last 10 years is 60.00%, and this year's acceptance rate is 40.00% at Chamberlain University-Michigan. By gender, men students' acceptance rate is 12.50% and women students' rate is 57.08%. For 2023 admission, it was slightly harder to get into Chamberlain University-Michigan than the previous year.
The next table and chart illustrate the acceptance rates changes at Chamberlain University-Michigan over the past 8 years (2015-2023).
| Year | Total | Men | Women |
|---|---|---|---|
| 2015-16 | 100.00% | 0.00% | 100.00% |
| 2016-17 | 40.00% -60.00% |
0.00% -50.00% |
50.00% -50.00% |
| 2017-18 | - | - | - |
| 2018-19 | 50.00% - |
0.00% - |
66.67% - |
| 2019-20 | 100.00% 50.00% |
0.00% 33.33% |
100.00% 33.33% |
| 2020-21 | 100.00% 0.00% |
0.00% 0.00% |
100.00% 0.00% |
| 2021-22 | 50.00% -50.00% |
100.00% -100.00% |
0.00% -100.00% |
| 2022-23 | 40.00% -10.00% |
0.00% 40.00% |
40.00% 40.00% |
| Average | 60.00% | 12.50% | 57.08% |