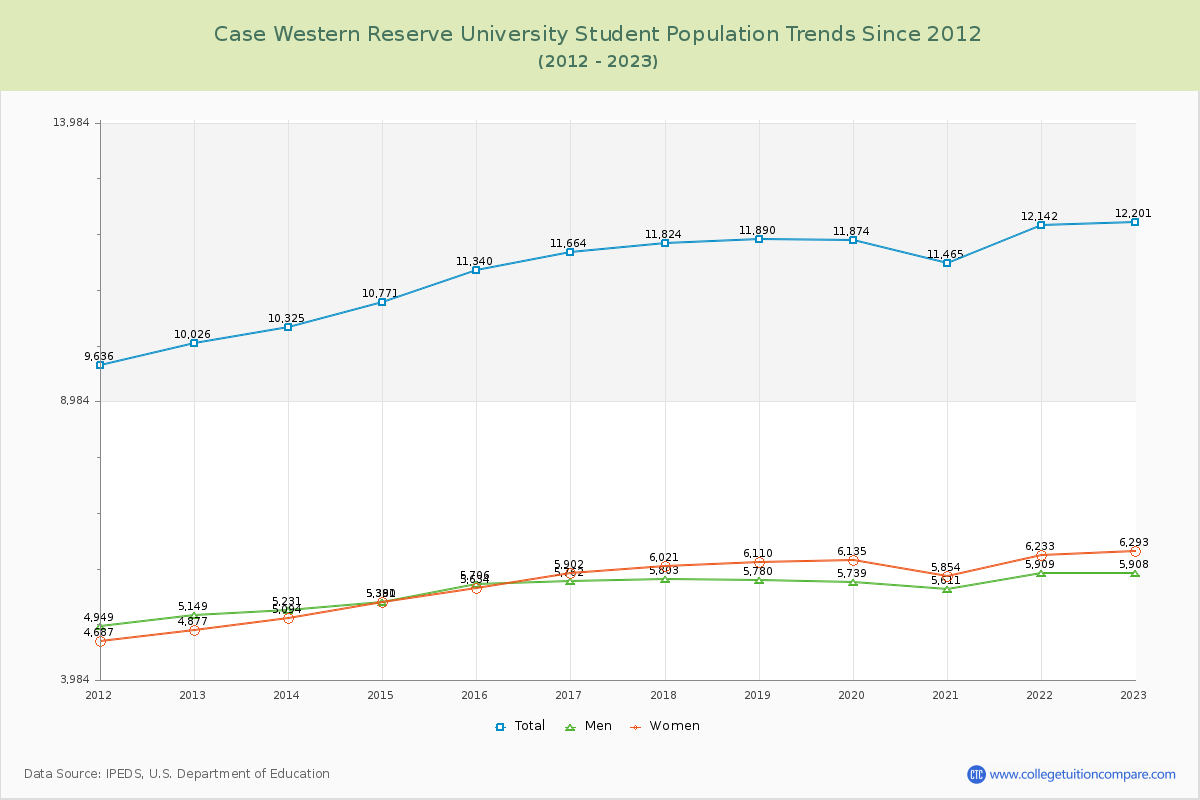
Student Population Changes
The average student population over the last 12 years is 11,411 where 12,201 students are attending the school for the academic year 2022-2023.
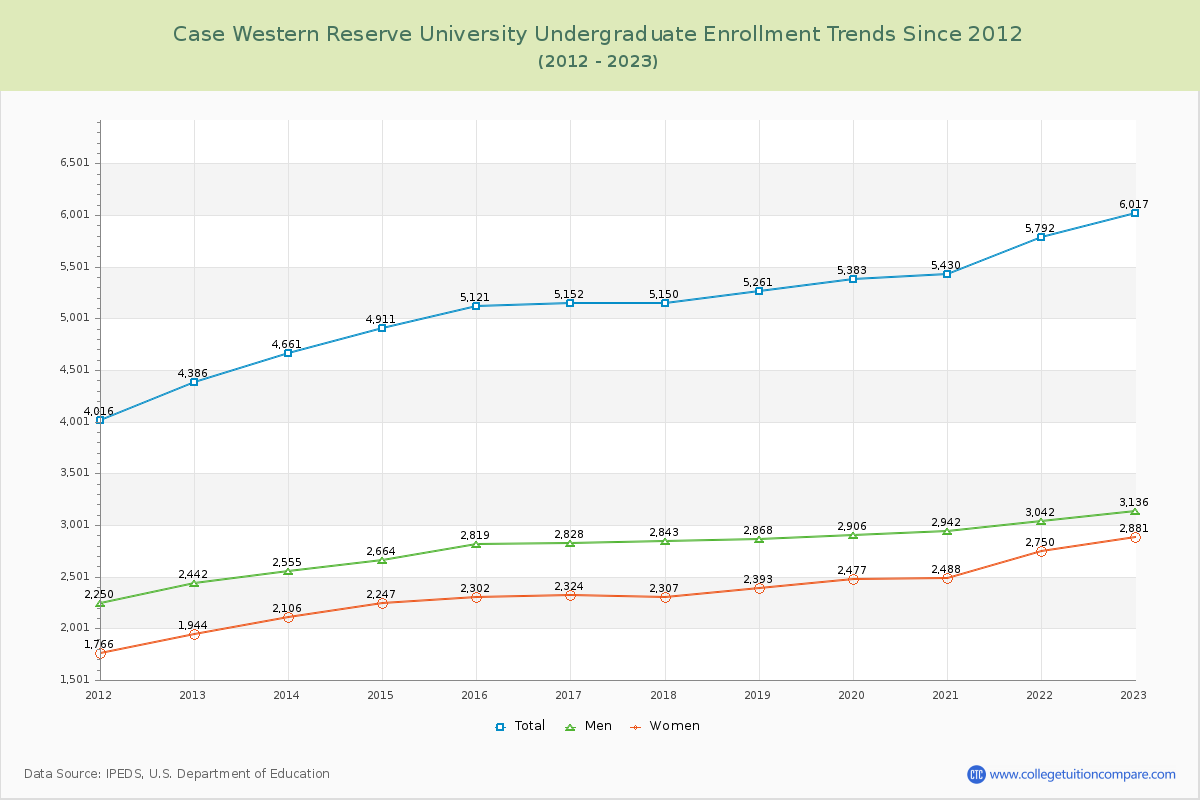
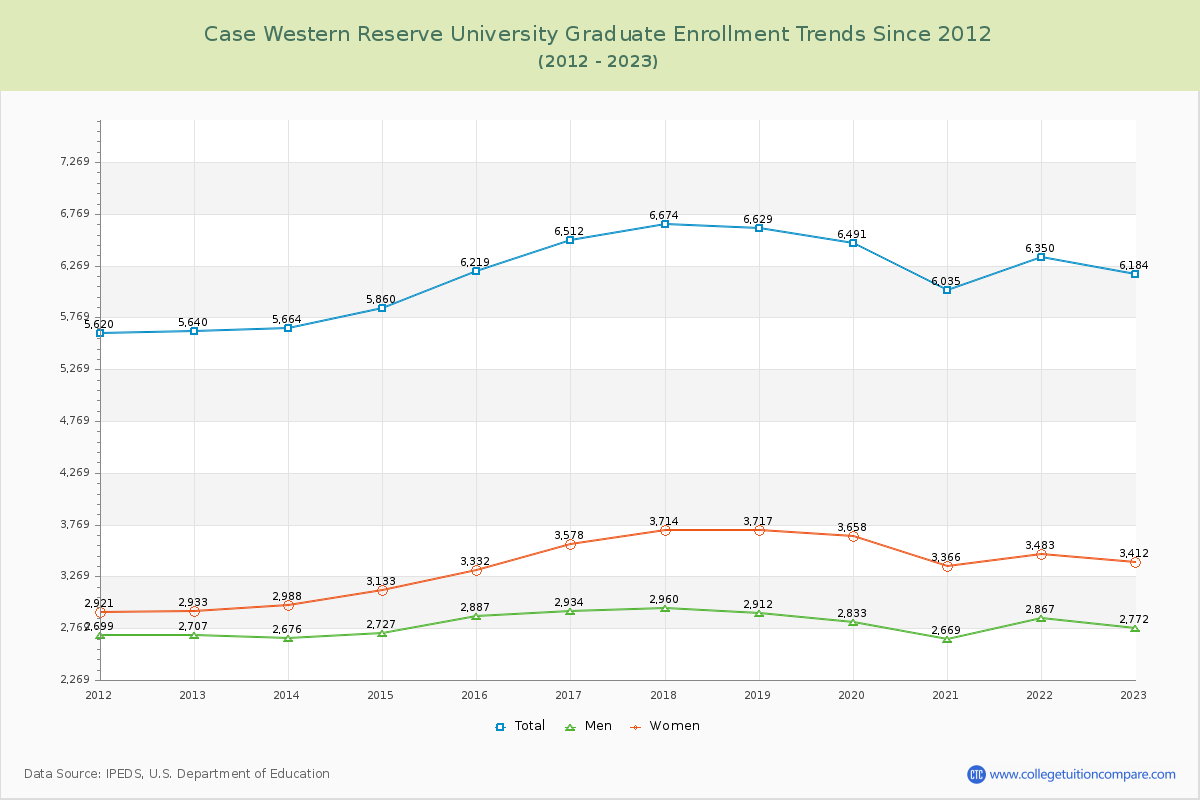
49.32% of total students is undergraduate students and 50.68% students is graduate students. The number of undergraduate students has increased by 1,631 and the graduate enrollment has increased by 544 over past 10 years.
The female to male ratio is 1.07 to 1 and it means that there are similar numbers of female and male students enrolled in CWRU.
The following table and chart illustrate the changes in student population by gender at Case Western Reserve University since 2012.
| Year | Total | Undergraduate | Graduate | ||||
|---|---|---|---|---|---|---|---|
| Total | Men | Women | Total | Men | Women | ||
| 2012-13 | 10,026 | 4,386 | 2,442 | 1,944 | 5,640 | 2,707 | 2,933 |
| 2013-14 | 10,325 299 | 4,661 275 | 2,555 113 | 2,106 162 | 5,664 24 | 2,676 -31 | 2,988 55 |
| 2014-15 | 10,771 446 | 4,911 250 | 2,664 109 | 2,247 141 | 5,860 196 | 2,727 51 | 3,133 145 |
| 2015-16 | 11,340 569 | 5,121 210 | 2,819 155 | 2,302 55 | 6,219 359 | 2,887 160 | 3,332 199 |
| 2016-17 | 11,664 324 | 5,152 31 | 2,828 9 | 2,324 22 | 6,512 293 | 2,934 47 | 3,578 246 |
| 2017-18 | 11,824 160 | 5,150 -2 | 2,843 15 | 2,307 -17 | 6,674 162 | 2,960 26 | 3,714 136 |
| 2018-19 | 11,890 66 | 5,261 111 | 2,868 25 | 2,393 86 | 6,629 -45 | 2,912 -48 | 3,717 3 |
| 2019-20 | 11,874 -16 | 5,383 122 | 2,906 38 | 2,477 84 | 6,491 -138 | 2,833 -79 | 3,658 -59 |
| 2020-21 | 11,465 -409 | 5,430 47 | 2,942 36 | 2,488 11 | 6,035 -456 | 2,669 -164 | 3,366 -292 |
| 2021-22 | 12,142 677 | 5,792 362 | 3,042 100 | 2,750 262 | 6,350 315 | 2,867 198 | 3,483 117 |
| 2022-23 | 12,201 59 | 6,017 225 | 3,136 94 | 2,881 131 | 6,184 -166 | 2,772 -95 | 3,412 -71 |
| Average | 11,411 | 5,206 | 2,822 | 2,384 | 6,205 | 2,813 | 3,392 |