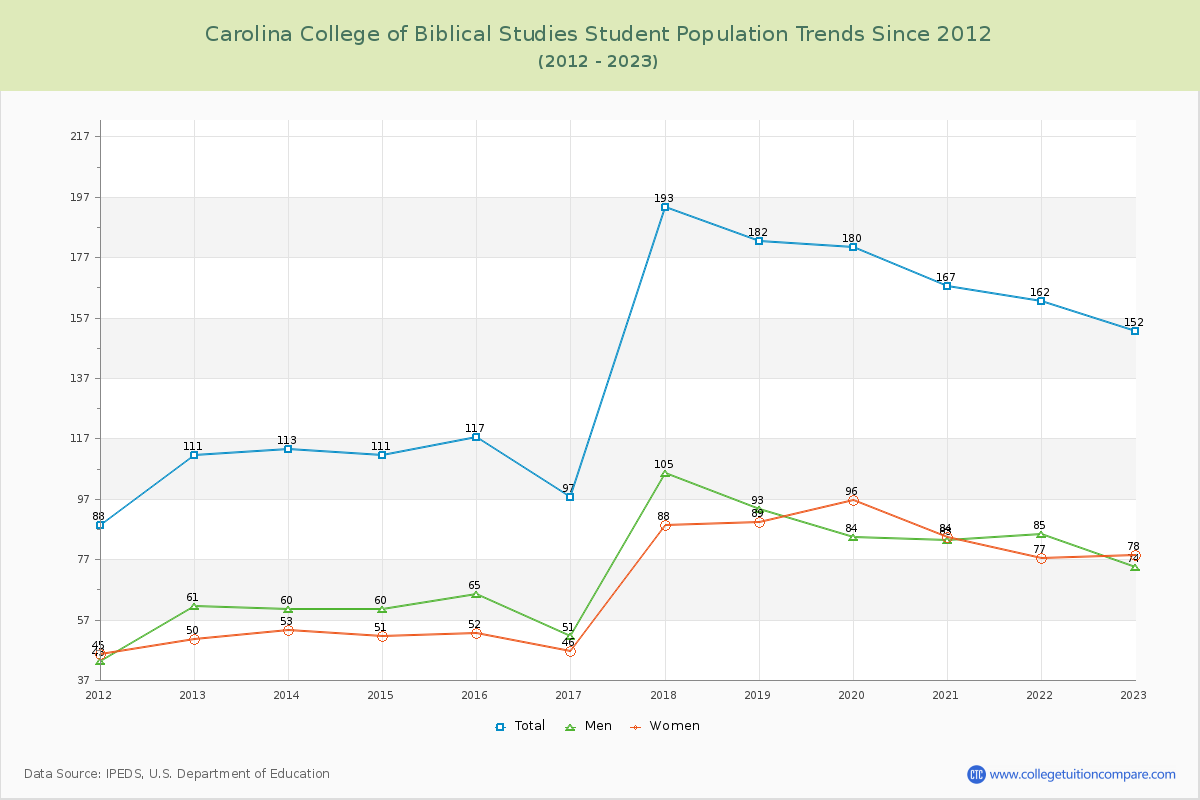
Student Population Changes
The average student population over the last 12 years is 144 where 152 students are attending the school for the academic year 2022-2023.
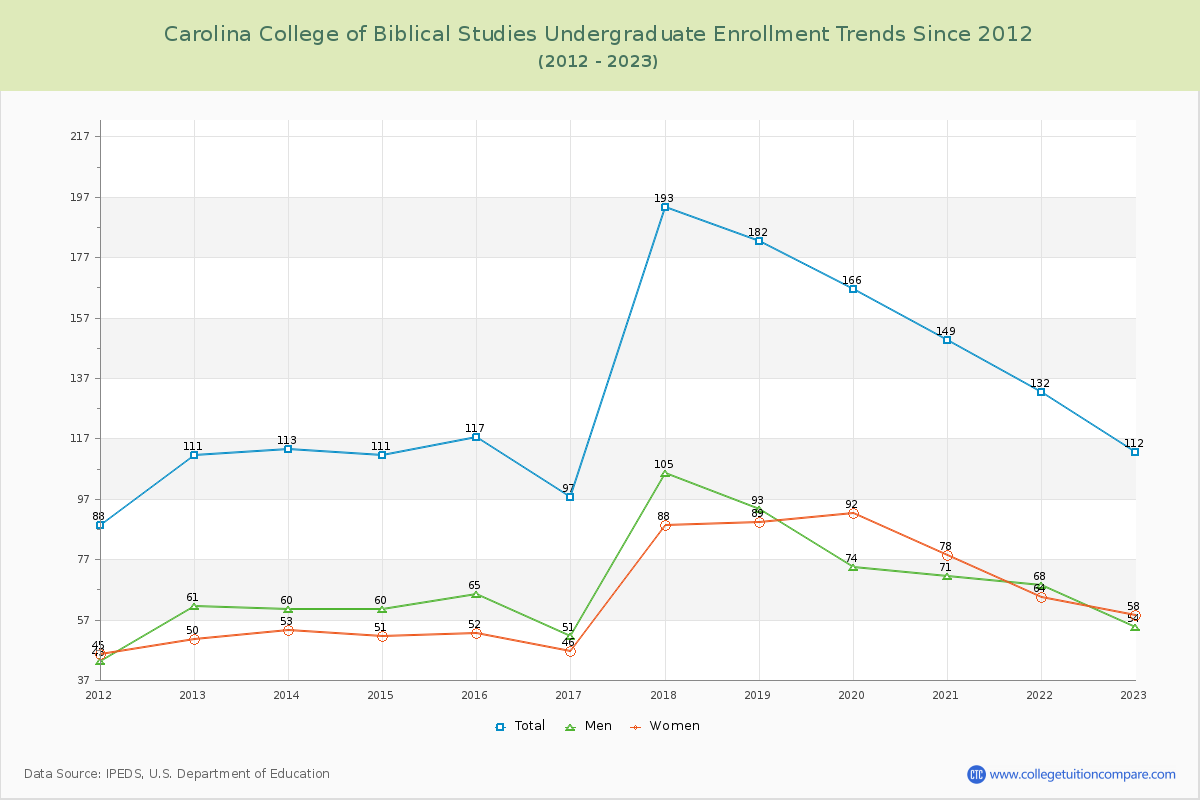
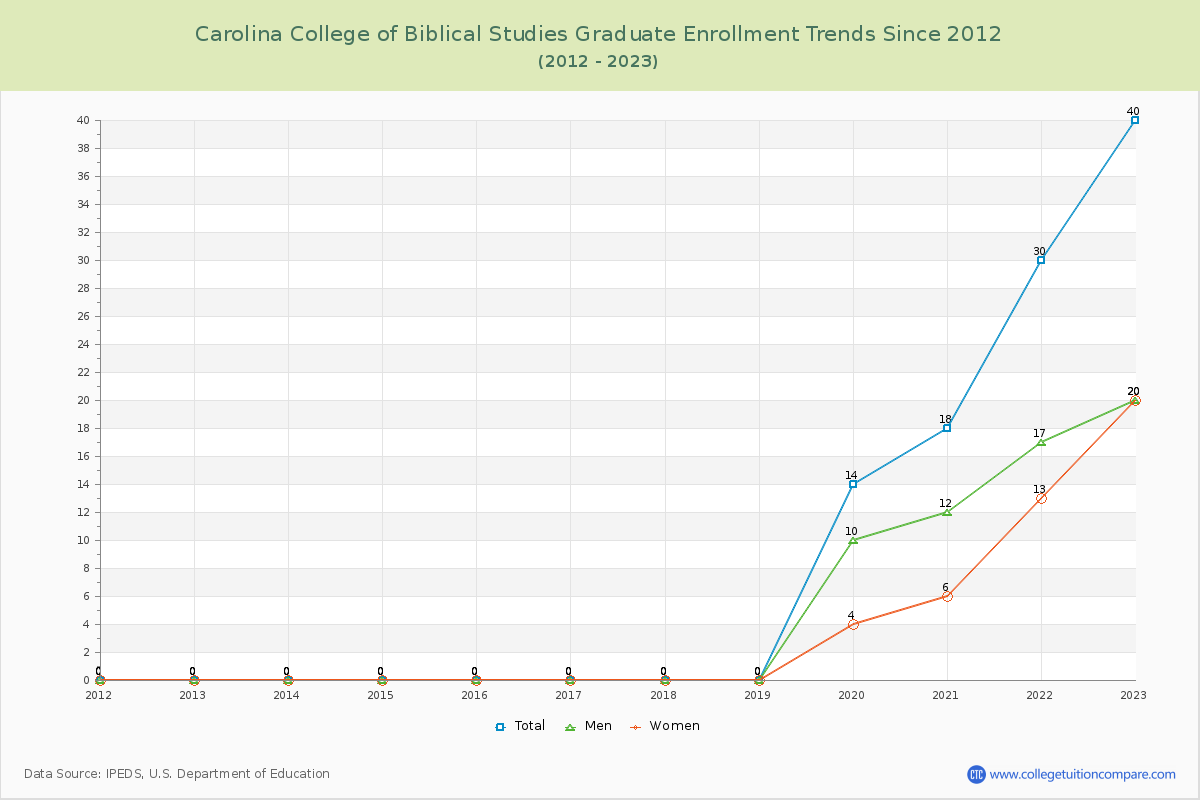
73.68% of total students is undergraduate students and 26.32% students is graduate students. The number of undergraduate students has increased by 1 and the graduate enrollment has increased by 40 over past 10 years.
The female to male ratio is 1.05 to 1 and it means that there are similar numbers of female and male students enrolled in Carolina College of Biblical Studies.
The following table and chart illustrate the changes in student population by gender at Carolina College of Biblical Studies since 2012.
| Year | Total | Undergraduate | Graduate | ||||
|---|---|---|---|---|---|---|---|
| Total | Men | Women | Total | Men | Women | ||
| 2012-13 | 111 | 111 | 61 | 50 | 0 | 0 | 0 |
| 2013-14 | 113 2 | 113 2 | 60 -1 | 53 3 | 0 0 | 0 0 | 0 0 |
| 2014-15 | 111 -2 | 111 -2 | 60 0 | 51 -2 | 0 0 | 0 0 | 0 0 |
| 2015-16 | 117 6 | 117 6 | 65 5 | 52 1 | 0 0 | 0 0 | 0 0 |
| 2016-17 | 97 -20 | 97 -20 | 51 -14 | 46 -6 | 0 0 | 0 0 | 0 0 |
| 2017-18 | 193 96 | 193 96 | 105 54 | 88 42 | 0 0 | 0 0 | 0 0 |
| 2018-19 | 182 -11 | 182 -11 | 93 -12 | 89 1 | 0 0 | 0 0 | 0 0 |
| 2019-20 | 180 -2 | 166 -16 | 74 -19 | 92 3 | 14 14 | 10 10 | 4 4 |
| 2020-21 | 167 -13 | 149 -17 | 71 -3 | 78 -14 | 18 4 | 12 2 | 6 2 |
| 2021-22 | 162 -5 | 132 -17 | 68 -3 | 64 -14 | 30 12 | 17 5 | 13 7 |
| 2022-23 | 152 -10 | 112 -20 | 54 -14 | 58 -6 | 40 10 | 20 3 | 20 7 |
| Average | 144 | 135 | 69 | 66 | 9 | 5 | 4 |