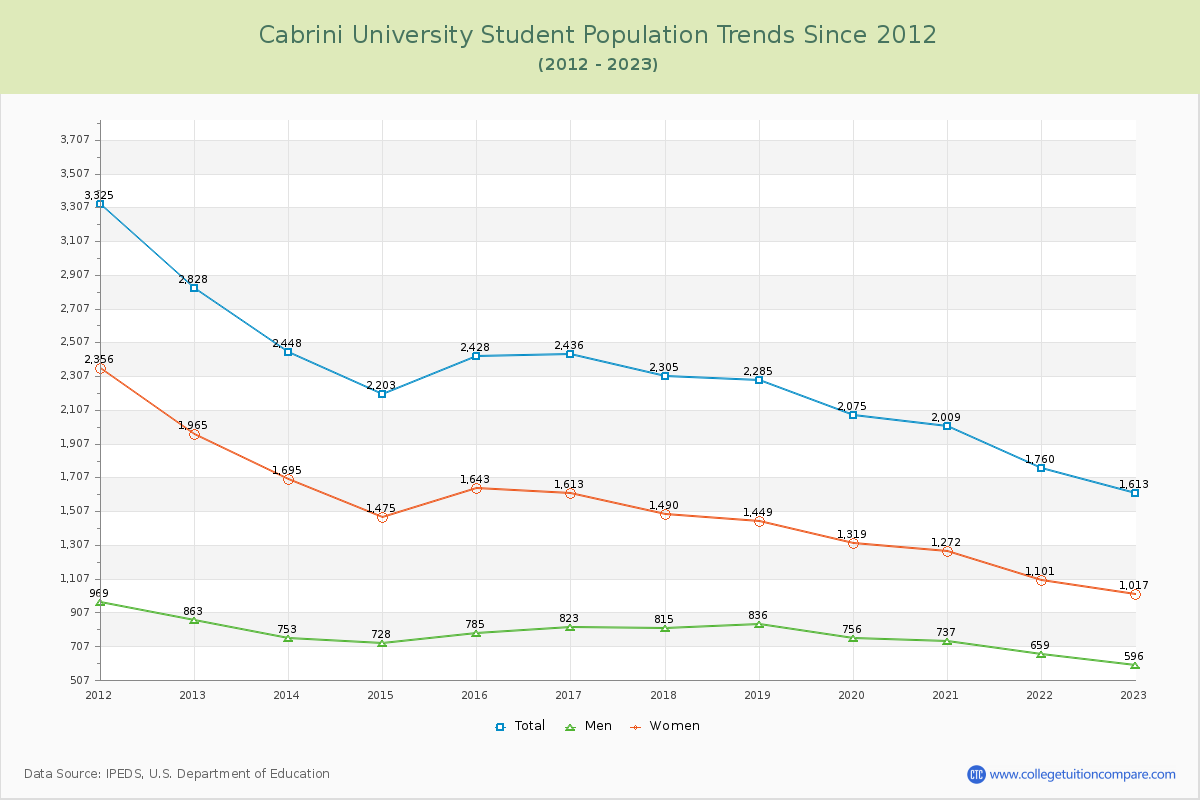
Student Population Changes
The average student population over the last 12 years is 2,217 where 1,613 students are attending the school for the academic year 2022-2023.
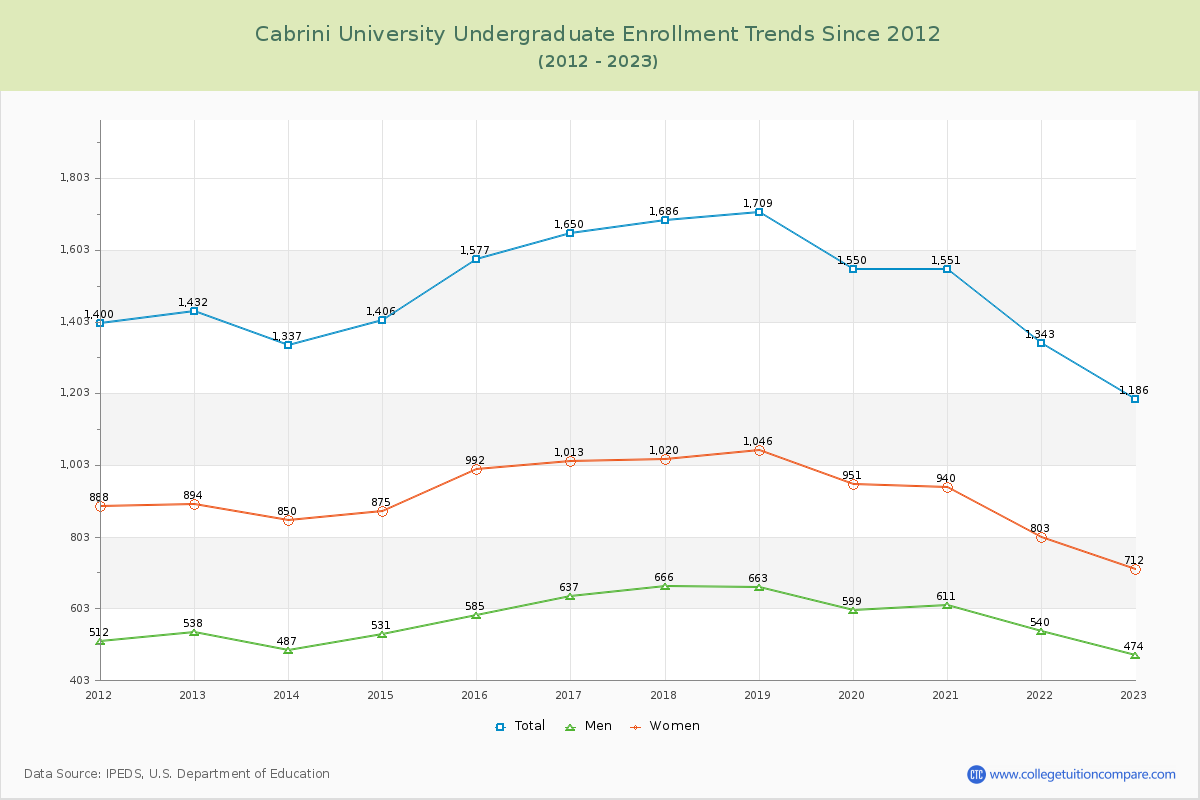
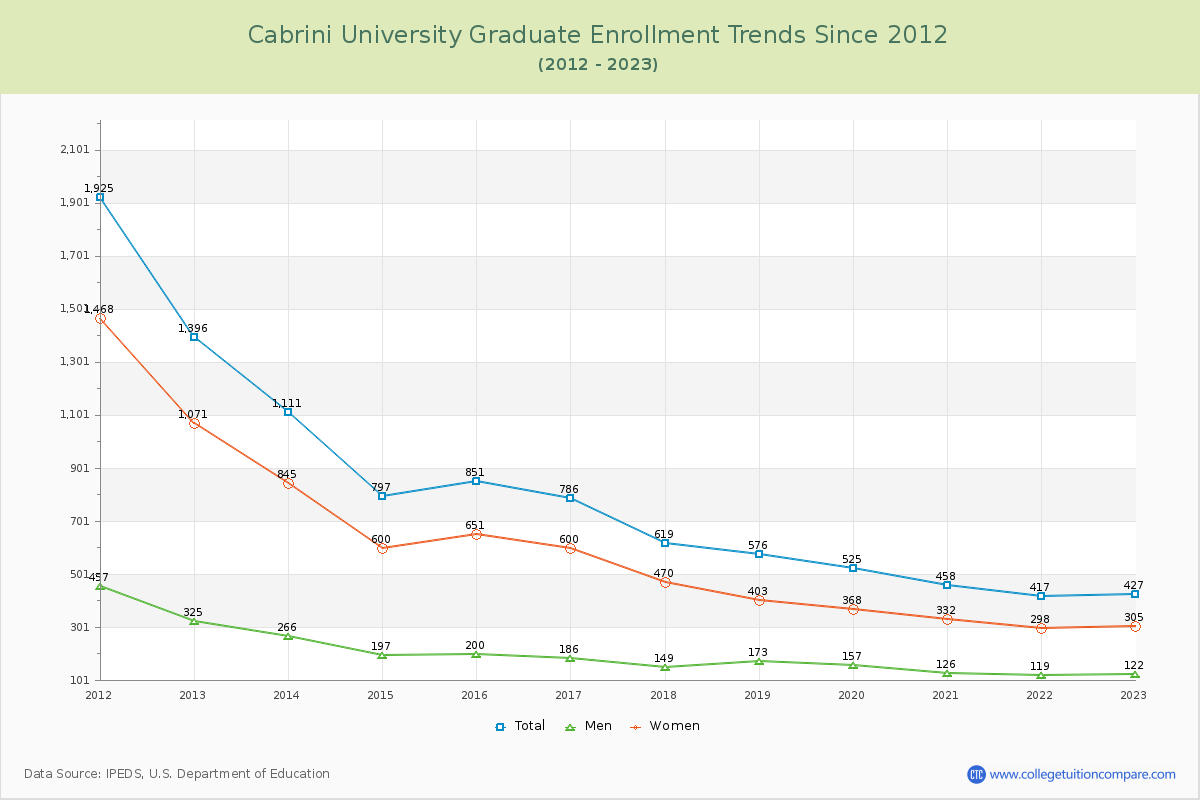
73.53% of total students is undergraduate students and 26.47% students is graduate students. The number of undergraduate students has decreased by 246 and the graduate enrollment has decreased by 969 over past 10 years.
The female to male ratio is 1.71 to 1 and it means that there are more female students enrolled in Cabrini than male students.
The following table and chart illustrate the changes in student population by gender at Cabrini University since 2012.
| Year | Total | Undergraduate | Graduate | ||||
|---|---|---|---|---|---|---|---|
| Total | Men | Women | Total | Men | Women | ||
| 2012-13 | 2,828 | 1,432 | 538 | 894 | 1,396 | 325 | 1,071 |
| 2013-14 | 2,448 -380 | 1,337 -95 | 487 -51 | 850 -44 | 1,111 -285 | 266 -59 | 845 -226 |
| 2014-15 | 2,203 -245 | 1,406 69 | 531 44 | 875 25 | 797 -314 | 197 -69 | 600 -245 |
| 2015-16 | 2,428 225 | 1,577 171 | 585 54 | 992 117 | 851 54 | 200 3 | 651 51 |
| 2016-17 | 2,436 8 | 1,650 73 | 637 52 | 1,013 21 | 786 -65 | 186 -14 | 600 -51 |
| 2017-18 | 2,305 -131 | 1,686 36 | 666 29 | 1,020 7 | 619 -167 | 149 -37 | 470 -130 |
| 2018-19 | 2,285 -20 | 1,709 23 | 663 -3 | 1,046 26 | 576 -43 | 173 24 | 403 -67 |
| 2019-20 | 2,075 -210 | 1,550 -159 | 599 -64 | 951 -95 | 525 -51 | 157 -16 | 368 -35 |
| 2020-21 | 2,009 -66 | 1,551 1 | 611 12 | 940 -11 | 458 -67 | 126 -31 | 332 -36 |
| 2021-22 | 1,760 -249 | 1,343 -208 | 540 -71 | 803 -137 | 417 -41 | 119 -7 | 298 -34 |
| 2022-23 | 1,613 -147 | 1,186 -157 | 474 -66 | 712 -91 | 427 10 | 122 3 | 305 7 |
| Average | 2,217 | 1,493 | 576 | 918 | 724 | 184 | 540 |