Student Population by Gender
Cabrini University has a total of 1,613 enrolled students for the academic year 2022-2023. 1,186 students have enrolled in undergraduate programs and 427 students joined graduate programs.
By gender, 596 male and 1,017 female students (the male-female ratio is 37:63) are attending the school. The gender distribution is based on the 2022-2023 data.
| Total | Undergraduate | Graduate | |
|---|---|---|---|
| Total | 1,613 | 1,186 | 427 |
| Men | 596 | 474 | 122 |
| Women | 1,017 | 712 | 305 |
Student Distribution by Race/Ethnicity
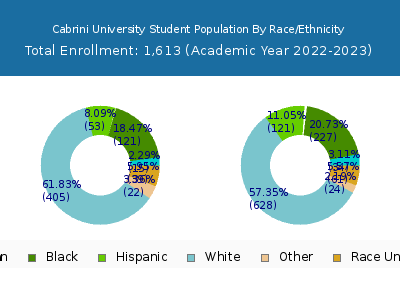
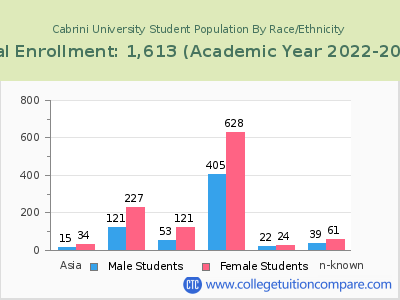
| Race | Total | Men | Women |
|---|---|---|---|
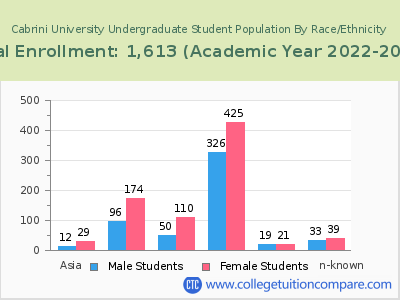
| American Indian or Native American | 2 | 1 | 1 |
| Asian | 43 | 12 | 31 |
| Black | 312 | 108 | 204 |
| Hispanic | 168 | 50 | 118 |
| Native Hawaiian or Other Pacific Islanders | 0 | 0 | 0 |
| White | 921 | 363 | 558 |
| Two or more races | 25 | 8 | 17 |
| Race Unknown | 124 | 47 | 77 |
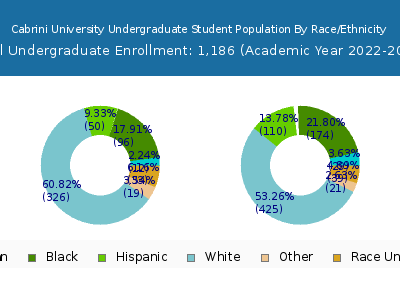
| Race | Total | Men | Women |
|---|---|---|---|
| American Indian or Native American | 1 | 0 | 1 |
| Asian | 30 | 8 | 22 |
| Black | 244 | 87 | 157 |
| Hispanic | 148 | 43 | 105 |
| Native Hawaiian or Other Pacific Islanders | 0 | 0 | 0 |
| White | 649 | 289 | 360 |
| Two or more races | 24 | 8 | 16 |
| Race Unknown | 72 | 32 | 40 |
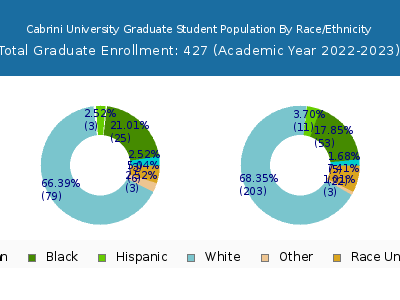
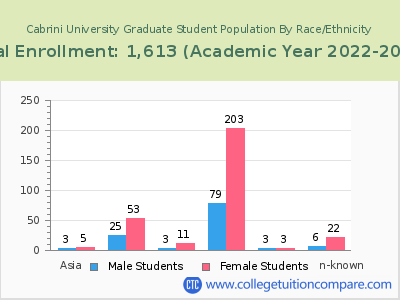
| Race | Total | Men | Women |
|---|---|---|---|
| American Indian or Native American | 1 | 0 | 1 |
| Asian | 3 | 0 | 3 |
| Black | 11 | 7 | 4 |
| Hispanic | 3 | 1 | 2 |
| Native Hawaiian or Other Pacific Islanders | 0 | 0 | 0 |
| White | 19 | 11 | 8 |
| Two or more races | 0 | 0 | 0 |
| Race Unknown | 11 | 5 | 6 |
Student Age Distribution
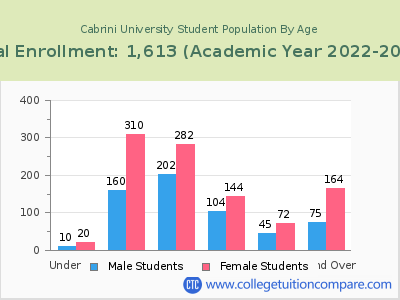
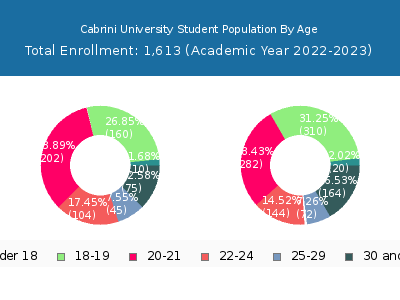
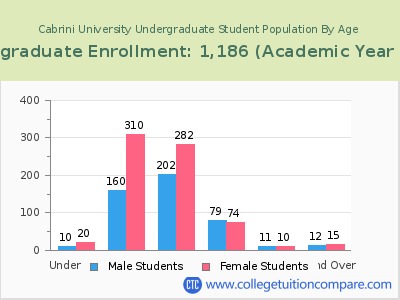
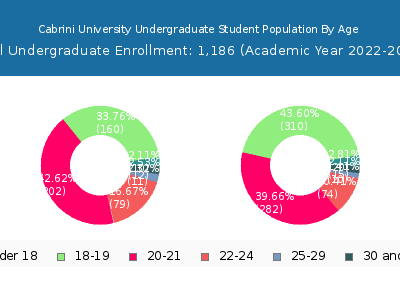
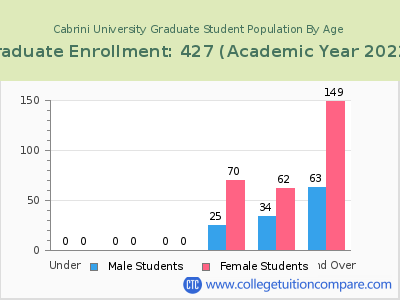
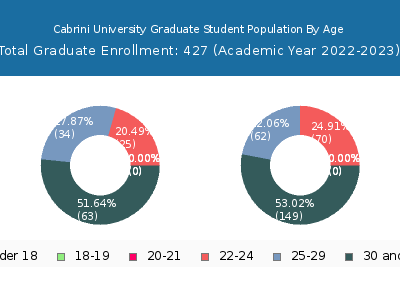
By age, Cabrini has 30 students under 18 years old and 3 students over 65 years old. There are 1,232 students under 25 years old, and 356 students over 25 years old out of 1,613 total students.
Cabrini has 1,137 undergraduate students aged under 25 and 48 students aged 25 and over.
It has 95 graduate students aged under 25 and 308 students aged 25 and over.
| Age | Total | Men | Women |
|---|---|---|---|
| Under 18 | 30 | 20 | 10 |
| 18-19 | 470 | 310 | 160 |
| 20-21 | 484 | 282 | 202 |
| 22-24 | 248 | 144 | 104 |
| 25-29 | 117 | 72 | 45 |
| 30-34 | 34 | 18 | 16 |
| 35-39 | 55 | 36 | 19 |
| 40-49 | 96 | 71 | 25 |
| 50-64 | 51 | 37 | 14 |
| Over 65 | 3 | 2 | 1 |
| Age | Total | Men | Women |
|---|---|---|---|
| Under 18 | 30 | 20 | 10 |
| 18-19 | 470 | 310 | 160 |
| 20-21 | 484 | 282 | 202 |
| 22-24 | 153 | 74 | 79 |
| 25-29 | 21 | 10 | 11 |
| 30-34 | 8 | 4 | 4 |
| 35-39 | 10 | 6 | 4 |
| 40-49 | 6 | 3 | 3 |
| 50-64 | 3 | 2 | 1 |
| Age | Total | Men | Women |
|---|
Online Student Enrollment
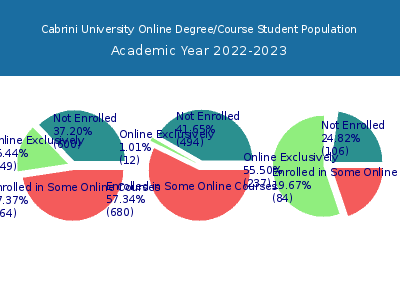
Distance learning, also called online education, is very attractive to students, especially who want to continue education and work in field. At Cabrini University, 249 students are enrolled exclusively in online courses and 764 students are enrolled in some online courses.
221 students lived in Pennsylvania or jurisdiction in which the school is located are enrolled exclusively in online courses and 28 students live in other State or outside of the United States.
| All Students | Enrolled Exclusively Online Courses | Enrolled in Some Online Courses | |
|---|---|---|---|
| All Students | 1,613 | 249 | 764 |
| Undergraduate | 1,186 | 12 | 680 |
| Graduate | 427 | 237 | 84 |
| Pennsylvania Residents | Other States in U.S. | Outside of U.S. | |
|---|---|---|---|
| All Students | 221 | 28 | 0 |
| Undergraduate | 12 | - | 0 |
| Graduate | 209 | 28 | 0 |
Transfer-in Students (Undergraduate)
Among 1,186 enrolled in undergraduate programs, 49 students have transferred-in from other institutions. The percentage of transfer-in students is 4.13%.45 students have transferred in as full-time status and 4 students transferred in as part-time status.
| Number of Students | |
|---|---|
| Regular Full-time | 1,057 |
| Transfer-in Full-time | 45 |
| Regular Part-time | 80 |
| Transfer-in Part-time | 4 |
