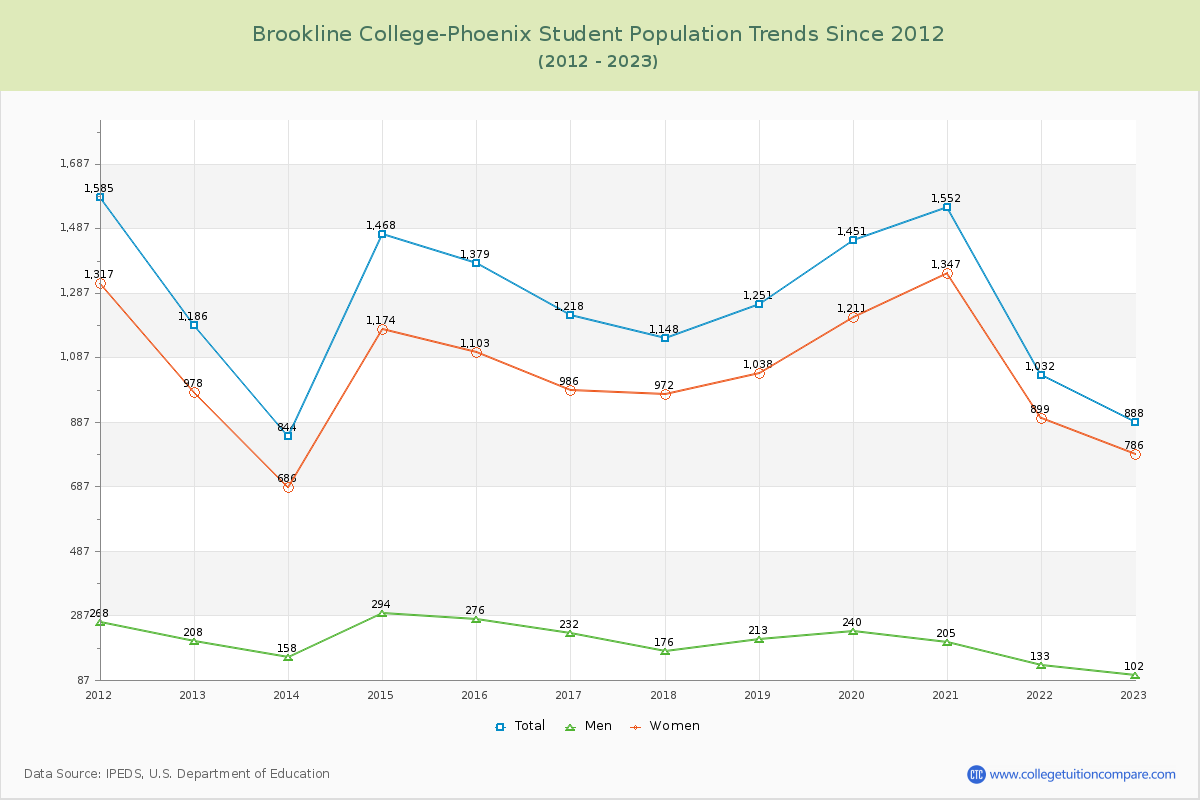
Student Population Changes
The average student population over the last 12 years is 1,220 where 888 students are attending the school for the academic year 2022-2023.
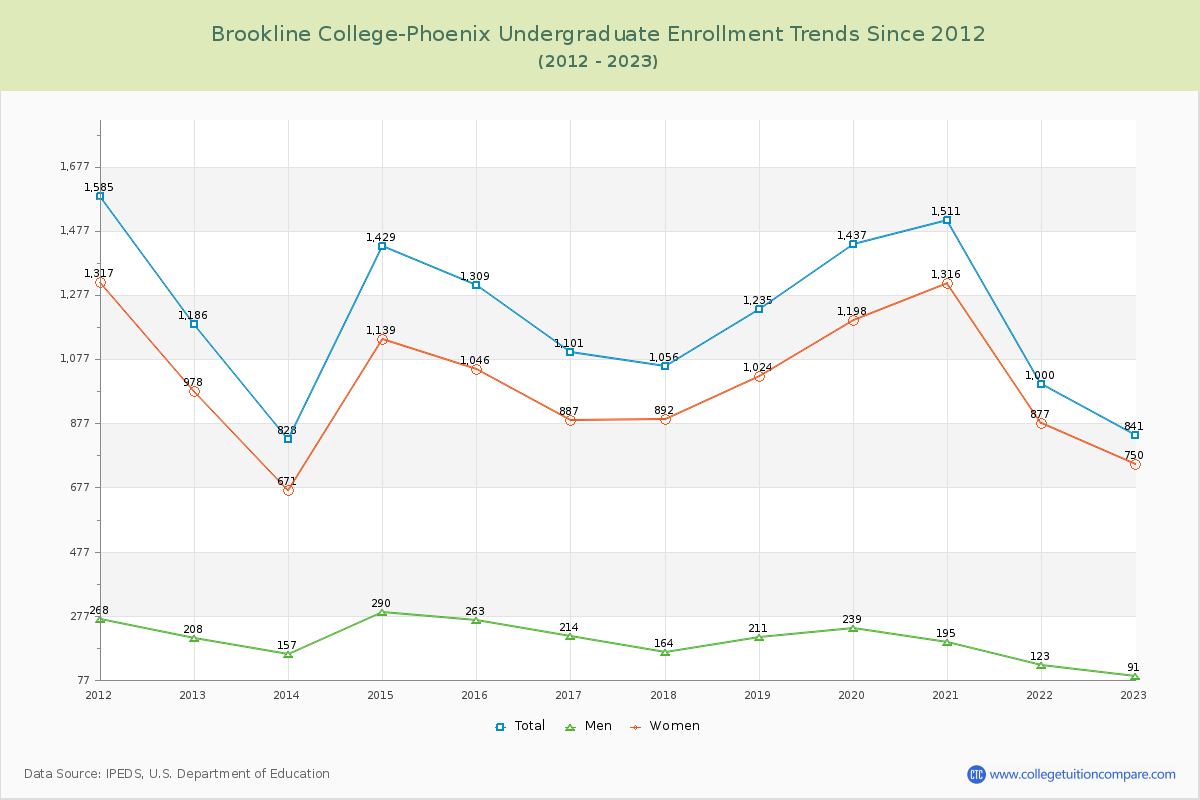
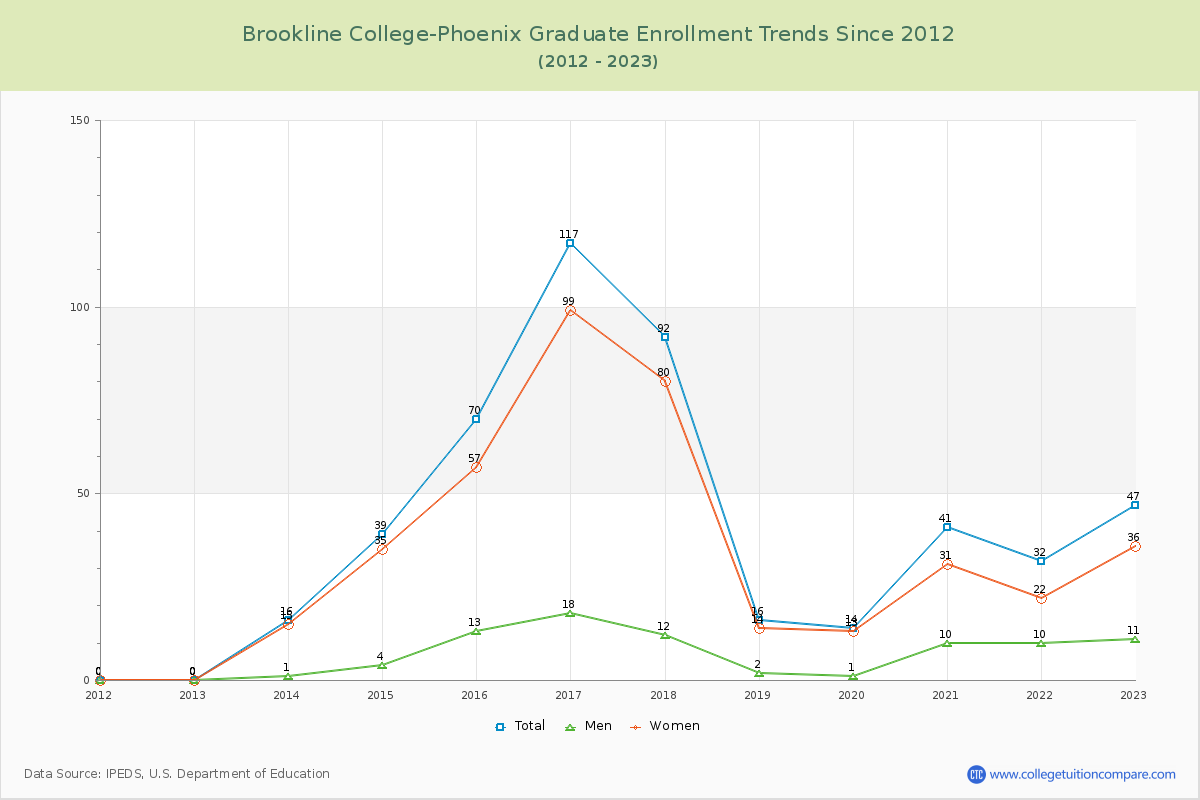
94.71% of total students is undergraduate students and 5.29% students is graduate students. The number of undergraduate students has decreased by 345 and the graduate enrollment has increased by 47 over past 10 years.
The female to male ratio is 7.71 to 1 and it means that there are far more female students enrolled in Brookline College-Phoenix than male students.
The following table and chart illustrate the changes in student population by gender at Brookline College-Phoenix since 2012.
| Year | Total | Undergraduate | Graduate | ||||
|---|---|---|---|---|---|---|---|
| Total | Men | Women | Total | Men | Women | ||
| 2012-13 | 1,186 | 1,186 | 208 | 978 | 0 | 0 | 0 |
| 2013-14 | 844 -342 | 828 -358 | 157 -51 | 671 -307 | 16 16 | 1 1 | 15 15 |
| 2014-15 | 1,468 624 | 1,429 601 | 290 133 | 1,139 468 | 39 23 | 4 3 | 35 20 |
| 2015-16 | 1,379 -89 | 1,309 -120 | 263 -27 | 1,046 -93 | 70 31 | 13 9 | 57 22 |
| 2016-17 | 1,218 -161 | 1,101 -208 | 214 -49 | 887 -159 | 117 47 | 18 5 | 99 42 |
| 2017-18 | 1,148 -70 | 1,056 -45 | 164 -50 | 892 5 | 92 -25 | 12 -6 | 80 -19 |
| 2018-19 | 1,251 103 | 1,235 179 | 211 47 | 1,024 132 | 16 -76 | 2 -10 | 14 -66 |
| 2019-20 | 1,451 200 | 1,437 202 | 239 28 | 1,198 174 | 14 -2 | 1 -1 | 13 -1 |
| 2020-21 | 1,552 101 | 1,511 74 | 195 -44 | 1,316 118 | 41 27 | 10 9 | 31 18 |
| 2021-22 | 1,032 -520 | 1,000 -511 | 123 -72 | 877 -439 | 32 -9 | 10 0 | 22 -9 |
| 2022-23 | 888 -144 | 841 -159 | 91 -32 | 750 -127 | 47 15 | 11 1 | 36 14 |
| Average | 1,220 | 1,176 | 196 | 980 | 44 | 7 | 37 |