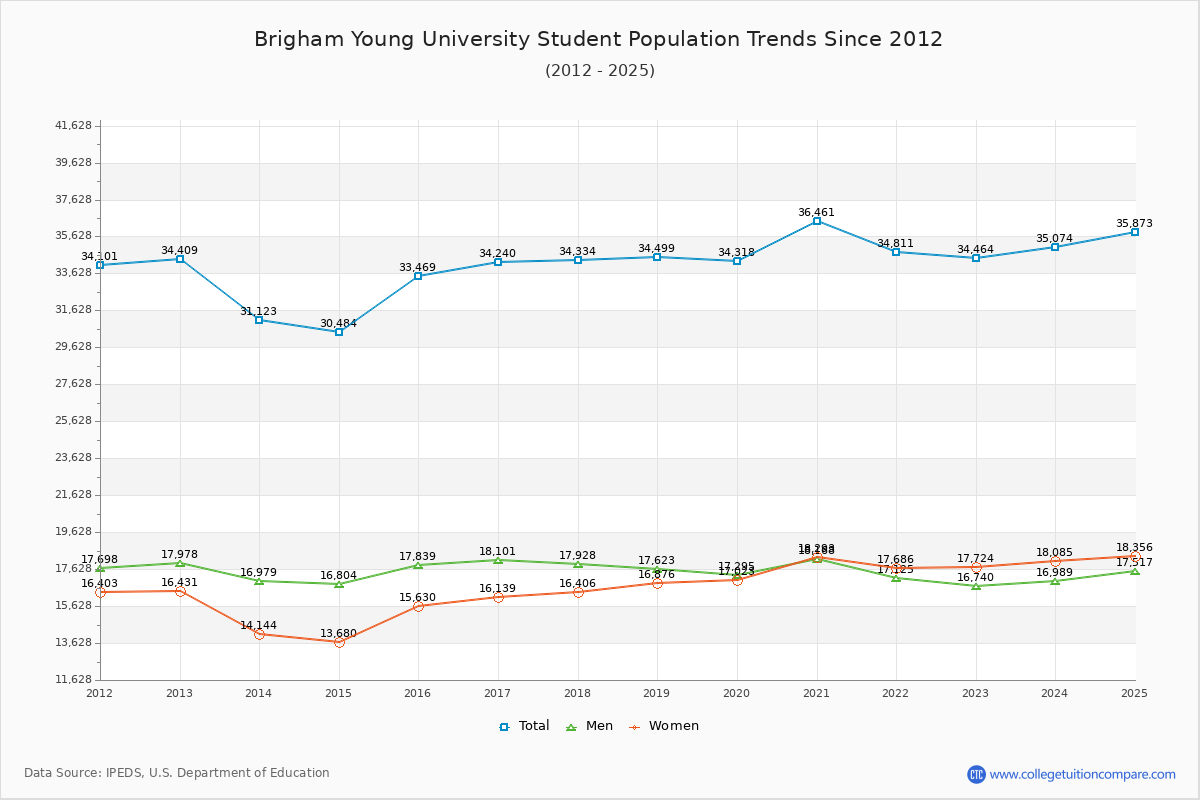
Student Population Changes
The average student population over the last 12 years is 33,874 where 34,464 students are attending the school for the academic year 2022-2023.
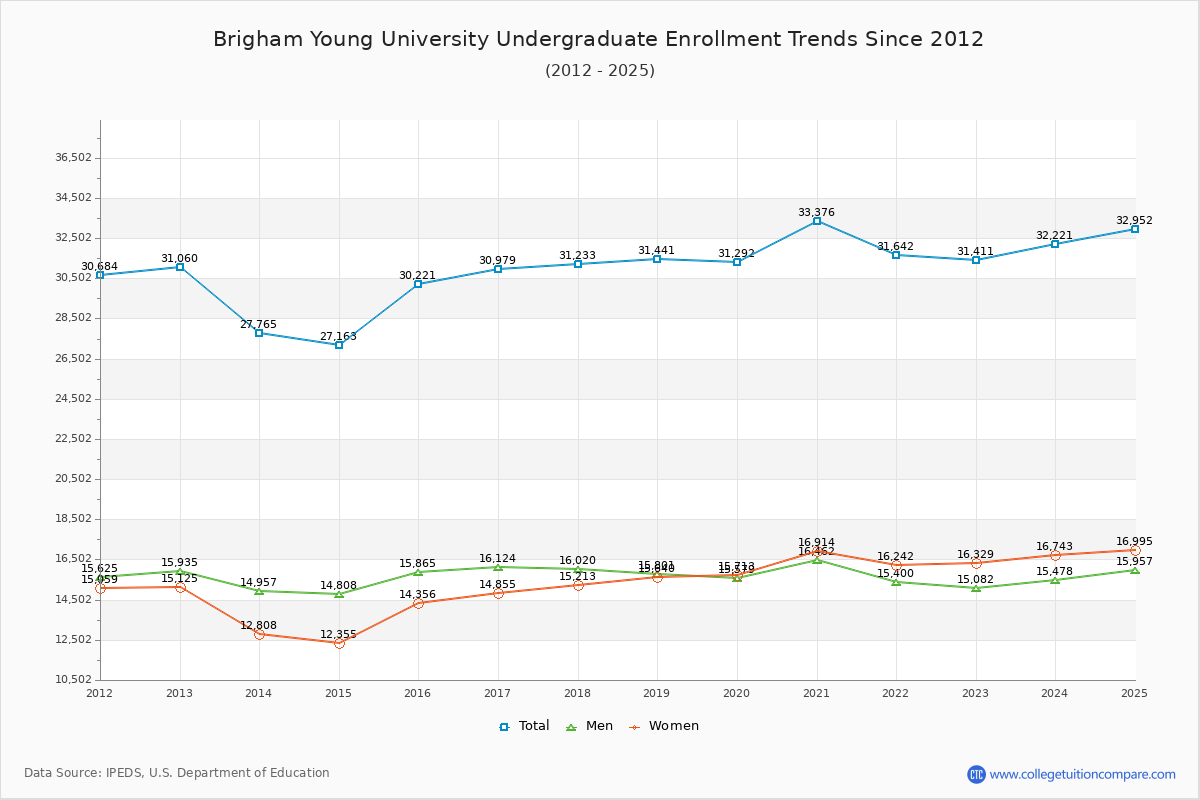
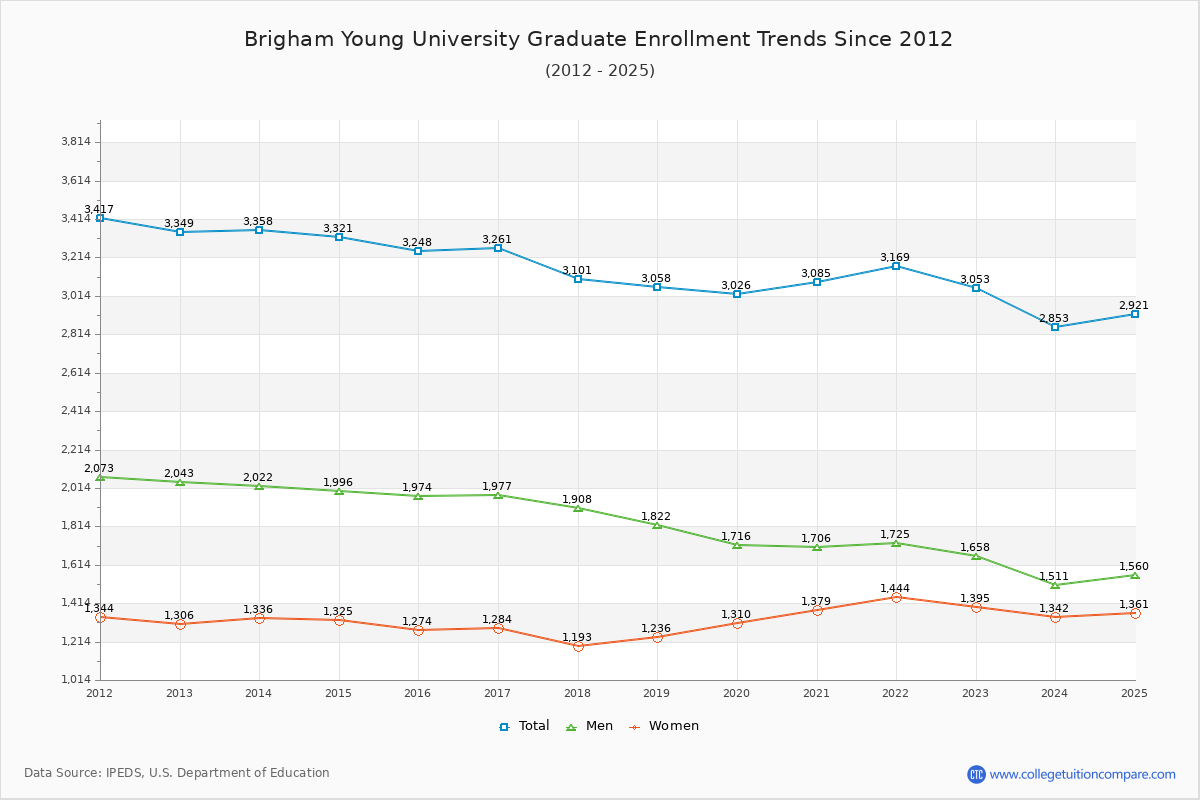
91.14% of total students is undergraduate students and 8.86% students is graduate students. The number of undergraduate students has increased by 351 and the graduate enrollment has decreased by 296 over past 10 years.
The female to male ratio is 1.06 to 1 and it means that there are similar numbers of female and male students enrolled in BYU.
The following table and chart illustrate the changes in student population by gender at Brigham Young University since 2012.
| Year | Total | Undergraduate | Graduate | ||||
|---|---|---|---|---|---|---|---|
| Total | Men | Women | Total | Men | Women | ||
| 2012-13 | 34,409 | 31,060 | 15,935 | 15,125 | 3,349 | 2,043 | 1,306 |
| 2013-14 | 31,123 -3,286 | 27,765 -3,295 | 14,957 -978 | 12,808 -2,317 | 3,358 9 | 2,022 -21 | 1,336 30 |
| 2014-15 | 30,484 -639 | 27,163 -602 | 14,808 -149 | 12,355 -453 | 3,321 -37 | 1,996 -26 | 1,325 -11 |
| 2015-16 | 33,469 2,985 | 30,221 3,058 | 15,865 1,057 | 14,356 2,001 | 3,248 -73 | 1,974 -22 | 1,274 -51 |
| 2016-17 | 34,240 771 | 30,979 758 | 16,124 259 | 14,855 499 | 3,261 13 | 1,977 3 | 1,284 10 |
| 2017-18 | 34,334 94 | 31,233 254 | 16,020 -104 | 15,213 358 | 3,101 -160 | 1,908 -69 | 1,193 -91 |
| 2018-19 | 34,499 165 | 31,441 208 | 15,801 -219 | 15,640 427 | 3,058 -43 | 1,822 -86 | 1,236 43 |
| 2019-20 | 34,318 -181 | 31,292 -149 | 15,579 -222 | 15,713 73 | 3,026 -32 | 1,716 -106 | 1,310 74 |
| 2020-21 | 36,461 2,143 | 33,376 2,084 | 16,462 883 | 16,914 1,201 | 3,085 59 | 1,706 -10 | 1,379 69 |
| 2021-22 | 34,811 -1,650 | 31,642 -1,734 | 15,400 -1,062 | 16,242 -672 | 3,169 84 | 1,725 19 | 1,444 65 |
| 2022-23 | 34,464 -347 | 31,411 -231 | 15,082 -318 | 16,329 87 | 3,053 -116 | 1,658 -67 | 1,395 -49 |
| Average | 33,874 | 30,689 | 15,639 | 15,050 | 3,184 | 1,868 | 1,317 |