Student Population by Gender
Brigham Young University has a total of 34,464 enrolled students for the academic year 2022-2023. 31,411 students have enrolled in undergraduate programs and 3,053 students joined graduate programs.
By gender, 16,740 male and 17,724 female students (the male-female ratio is 49:51) are attending the school. The gender distribution is based on the 2022-2023 data.
| Total | Undergraduate | Graduate | |
|---|---|---|---|
| Total | 34,464 | 31,411 | 3,053 |
| Men | 16,740 | 15,082 | 1,658 |
| Women | 17,724 | 16,329 | 1,395 |
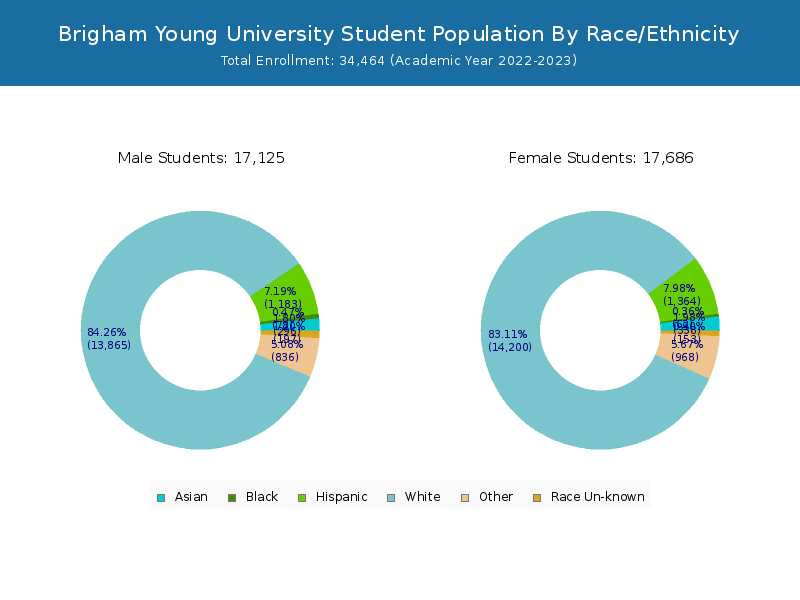
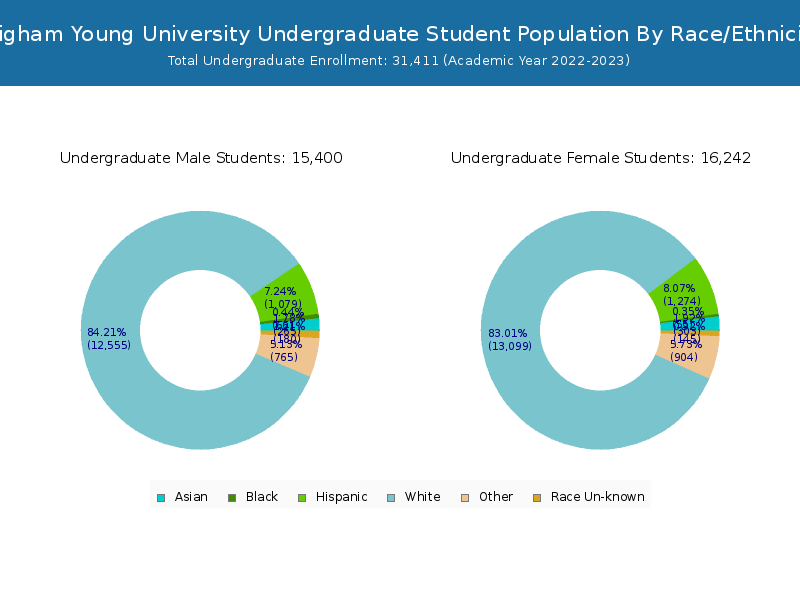
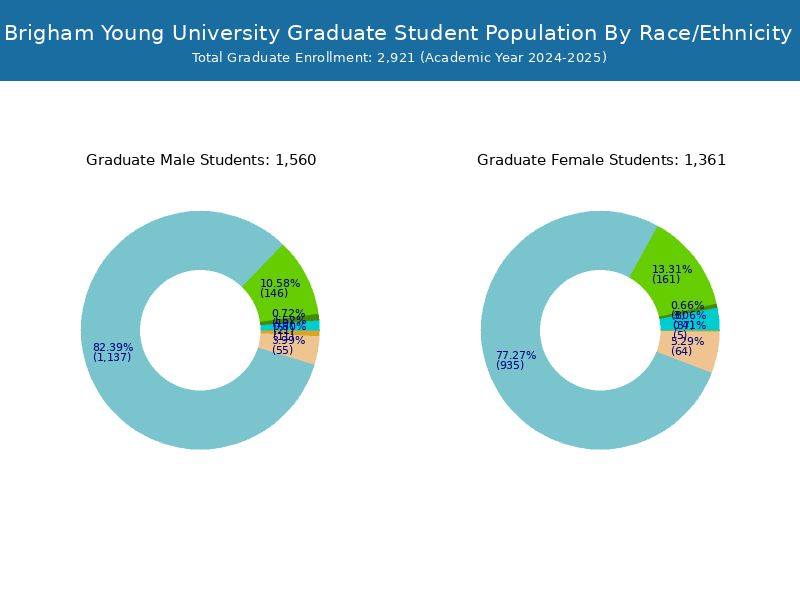
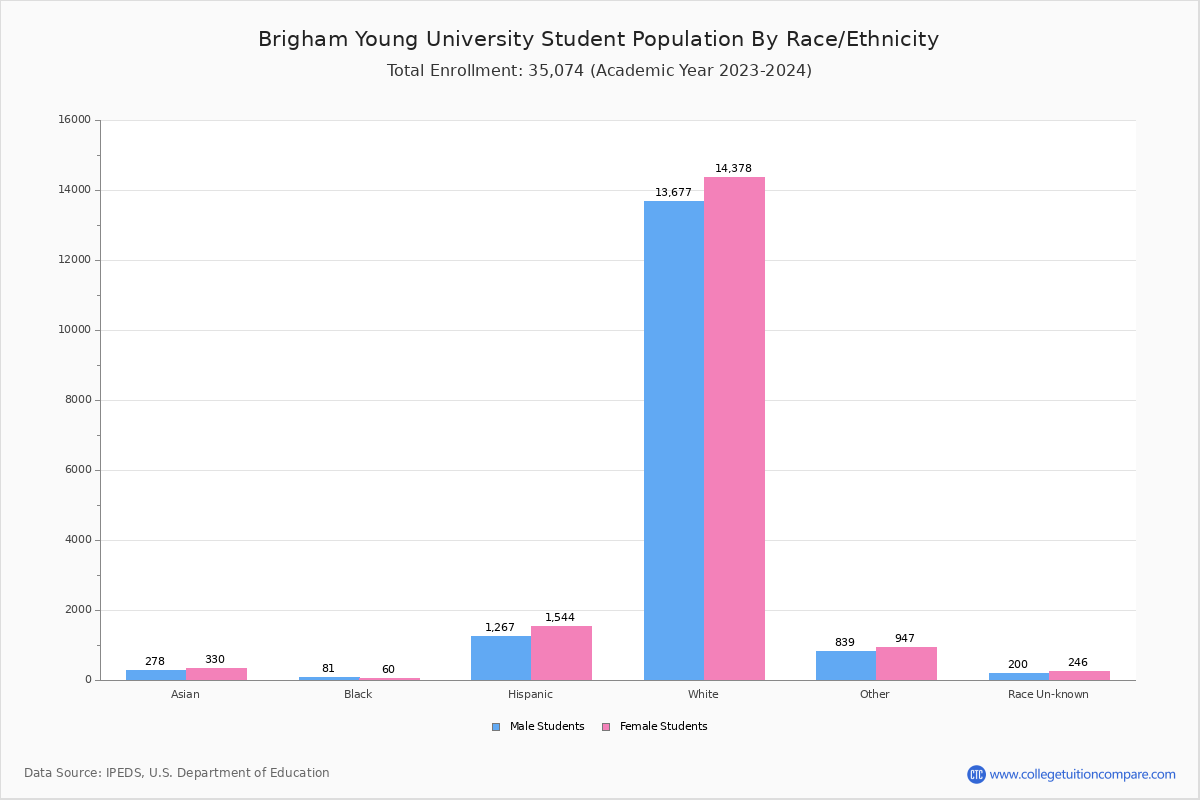
Student Distribution by Race/Ethnicity
By race/ethnicity, 27,621 White, 155 Black, and 629 Asian students out of a total of 34,464 are attending at Brigham Young University. Comprehensive enrollment statistic data by race/ethnicity is shown in the next chart (Academic year 2022-2023 data).
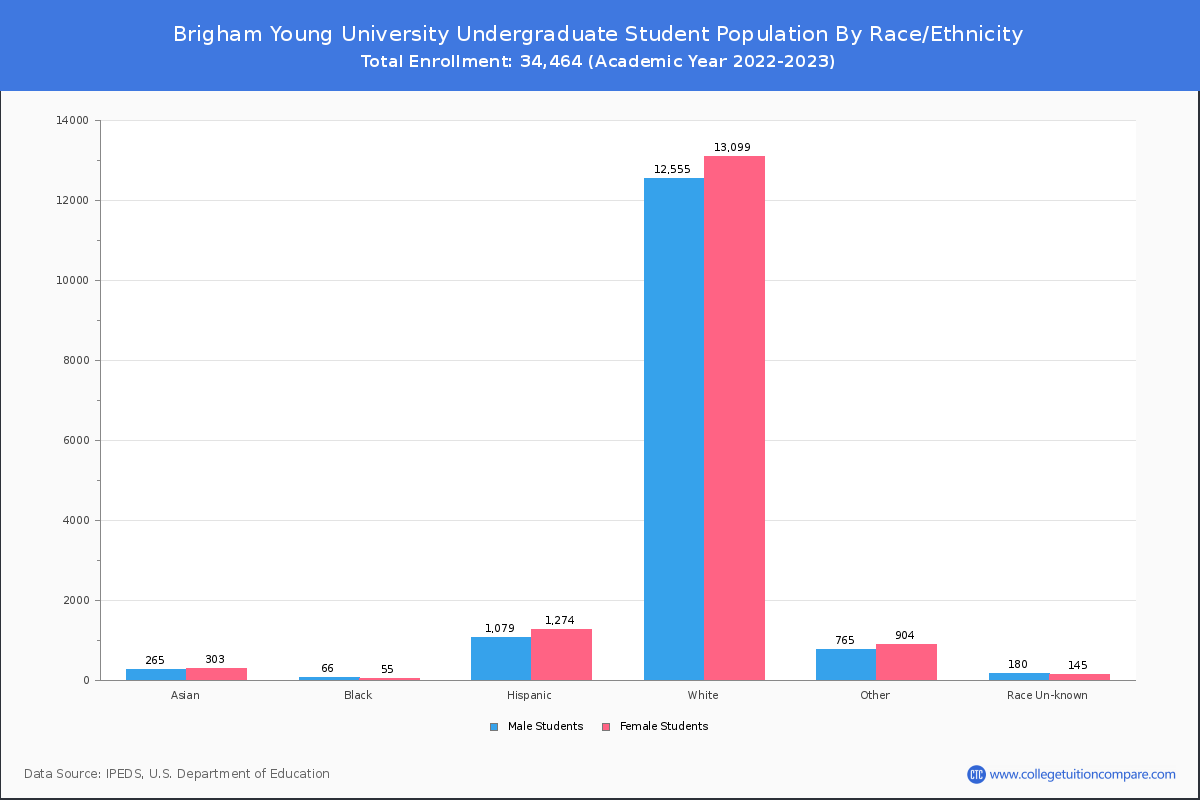
| Race | Total | Men | Women |
|---|---|---|---|
| American Indian or Native American | 77 | 35 | 42 |
| Asian | 629 | 299 | 330 |
| Black | 155 | 83 | 72 |
| Hispanic | 2,701 | 1,215 | 1,486 |
| Native Hawaiian or Other Pacific Islanders | 237 | 124 | 113 |
| White | 27,621 | 13,484 | 14,137 |
| Two or more races | 1,531 | 691 | 840 |
| Race Unknown | 274 | 150 | 124 |
| Race | Total | Men | Women |
|---|---|---|---|
| American Indian or Native American | 70 | 29 | 41 |
| Asian | 556 | 272 | 284 |
| Black | 133 | 68 | 65 |
| Hispanic | 2,490 | 1,112 | 1,378 |
| Native Hawaiian or Other Pacific Islanders | 217 | 112 | 105 |
| White | 25,382 | 12,245 | 13,137 |
| Two or more races | 1,406 | 630 | 776 |
| Race Unknown | 248 | 134 | 114 |
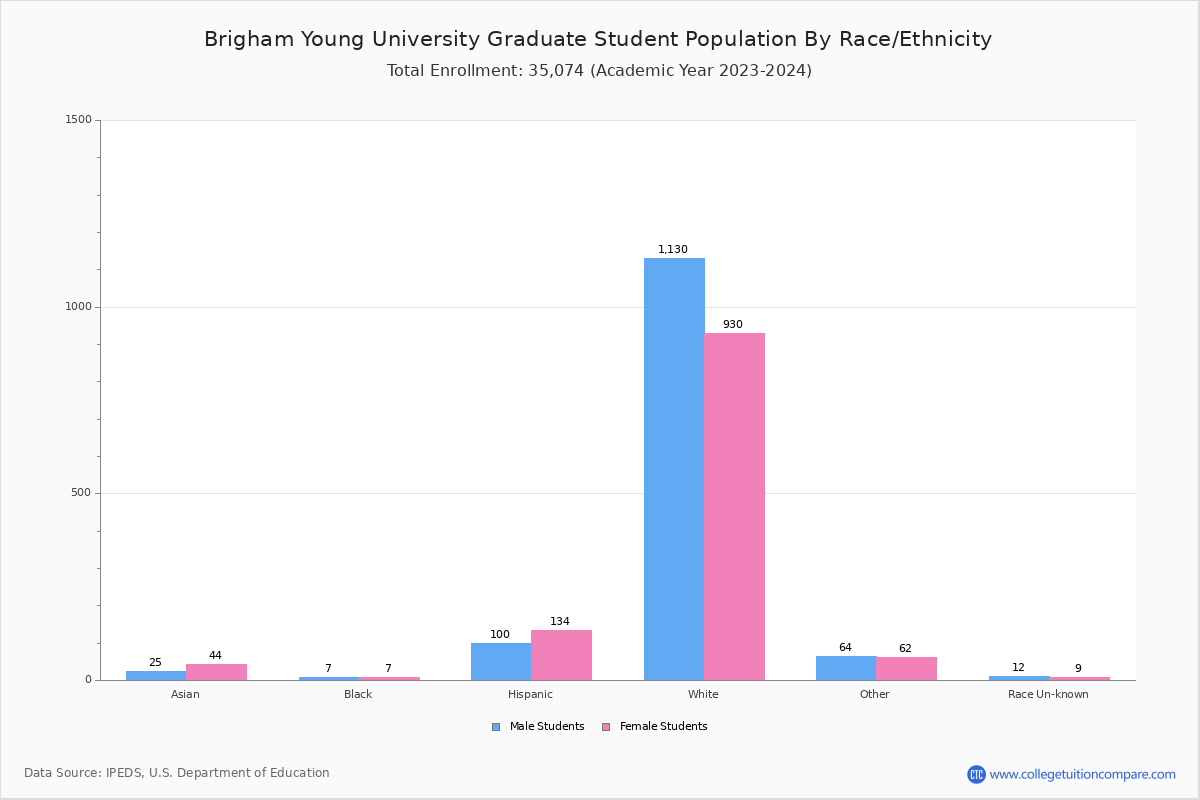
| Race | Total | Men | Women |
|---|---|---|---|
| American Indian or Native American | 1 | 0 | 1 |
| Asian | 21 | 12 | 9 |
| Black | 3 | 2 | 1 |
| Hispanic | 94 | 44 | 50 |
| Native Hawaiian or Other Pacific Islanders | 9 | 6 | 3 |
| White | 749 | 327 | 422 |
| Two or more races | 36 | 15 | 21 |
| Race Unknown | 13 | 6 | 7 |
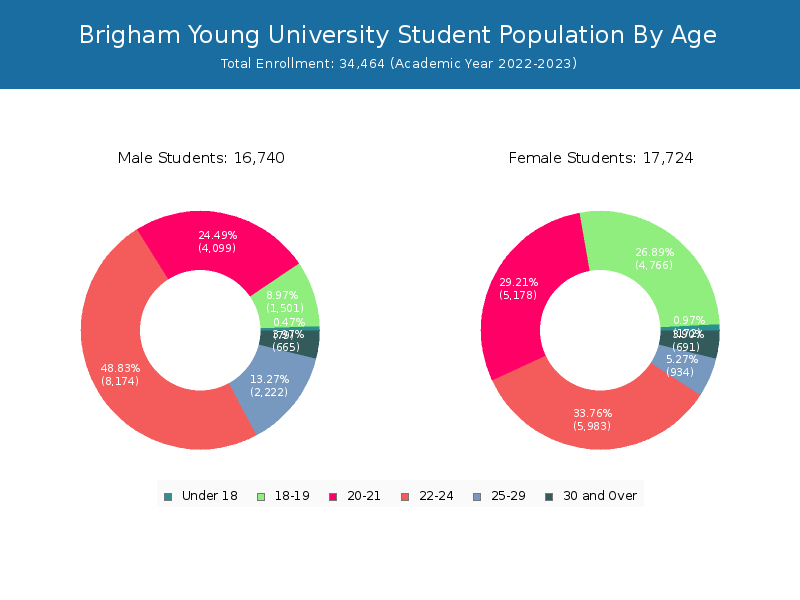
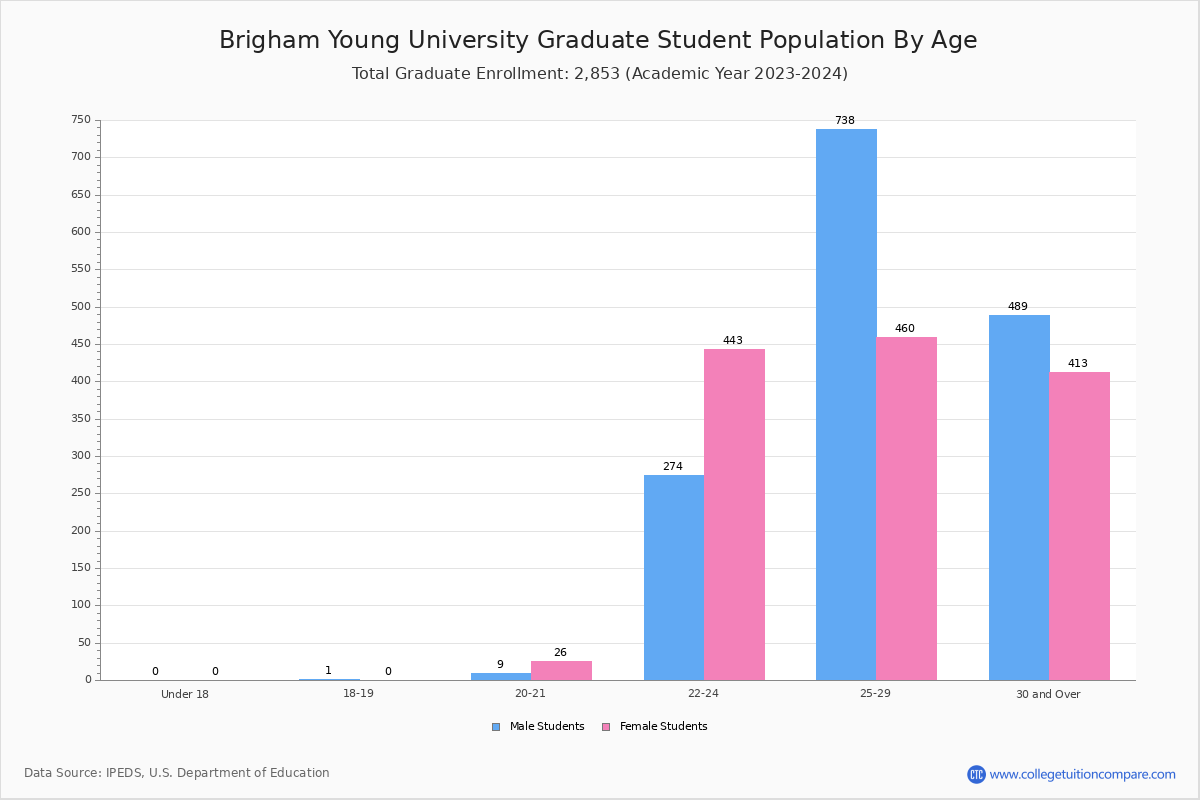
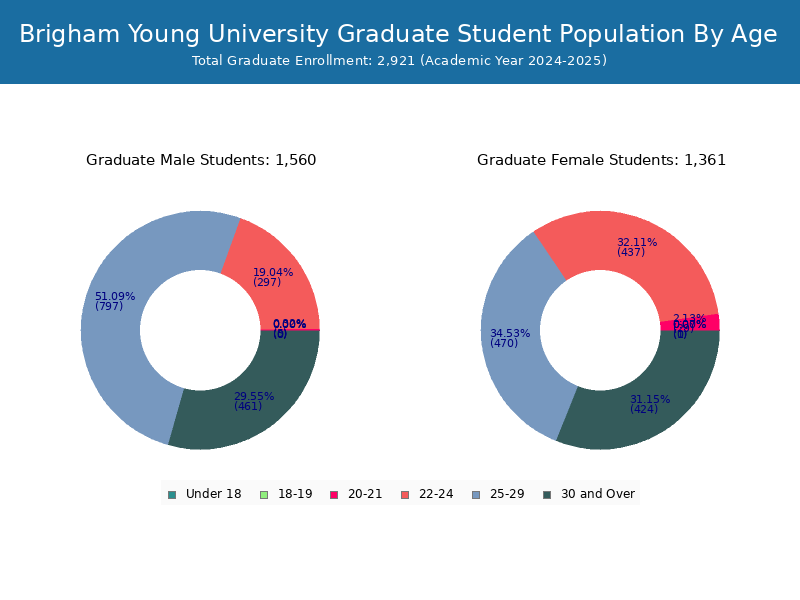
Student Age Distribution
By age, BYU has 251 students under 18 years old and 10 students over 65 years old. There are 29,952 students under 25 years old, and 4,512 students over 25 years old out of 34,464 total students.
In undergraduate programs, 251 students are younger than 18 and 5 students are older than 65. BYU has 29,193 undergraduate students aged under 25 and 2,218 students aged 25 and over.
It has 759 graduate students aged under 25 and 2,294 students aged 25 and over.
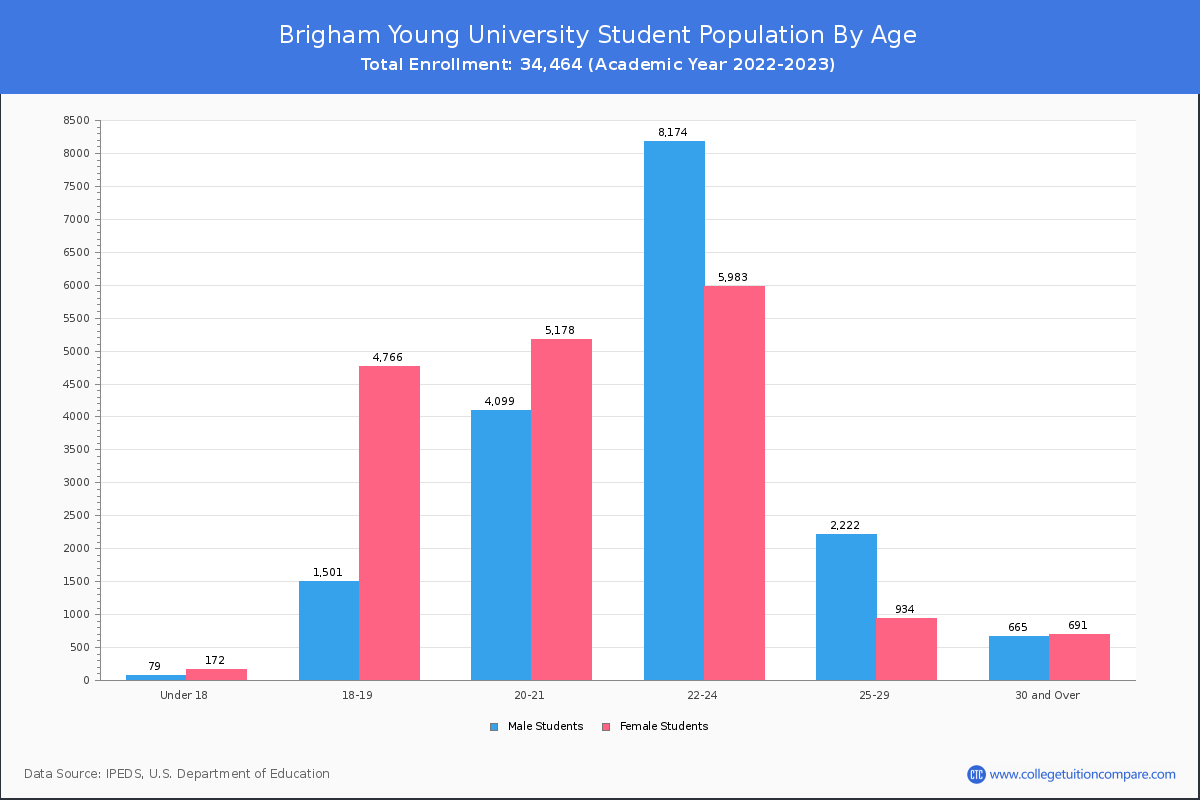
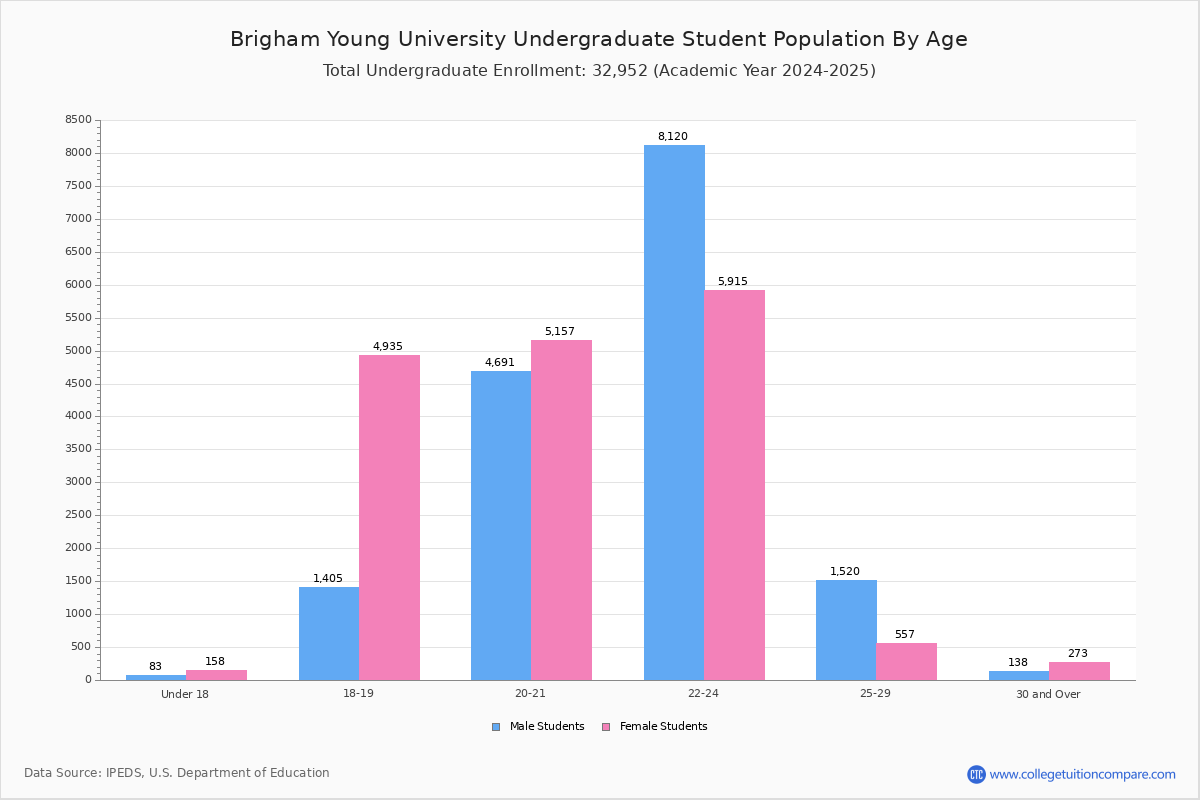
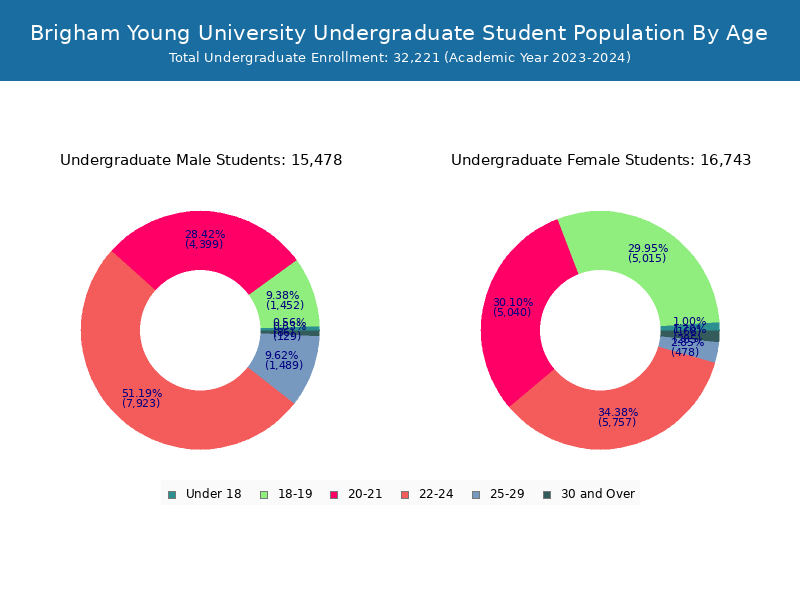
| Age | Total | Men | Women |
|---|---|---|---|
| Under 18 | 251 | 172 | 79 |
| 18-19 | 6,267 | 4,766 | 1,501 |
| 20-21 | 9,277 | 5,178 | 4,099 |
| 22-24 | 14,157 | 5,983 | 8,174 |
| 25-29 | 3,156 | 934 | 2,222 |
| 30-34 | 564 | 189 | 375 |
| 35-39 | 262 | 130 | 132 |
| 40-49 | 345 | 225 | 120 |
| 50-64 | 175 | 141 | 34 |
| Over 65 | 10 | 6 | 4 |
| Age | Total | Men | Women |
|---|---|---|---|
| Under 18 | 251 | 172 | 79 |
| 18-19 | 6,267 | 4,766 | 1,501 |
| 20-21 | 9,251 | 5,155 | 4,096 |
| 22-24 | 13,424 | 5,553 | 7,871 |
| 25-29 | 1,877 | 457 | 1,420 |
| 30-34 | 130 | 52 | 78 |
| 35-39 | 51 | 35 | 16 |
| 40-49 | 76 | 63 | 13 |
| 50-64 | 79 | 72 | 7 |
| Over 65 | 5 | 4 | 1 |
| Age | Total | Men | Women |
|---|
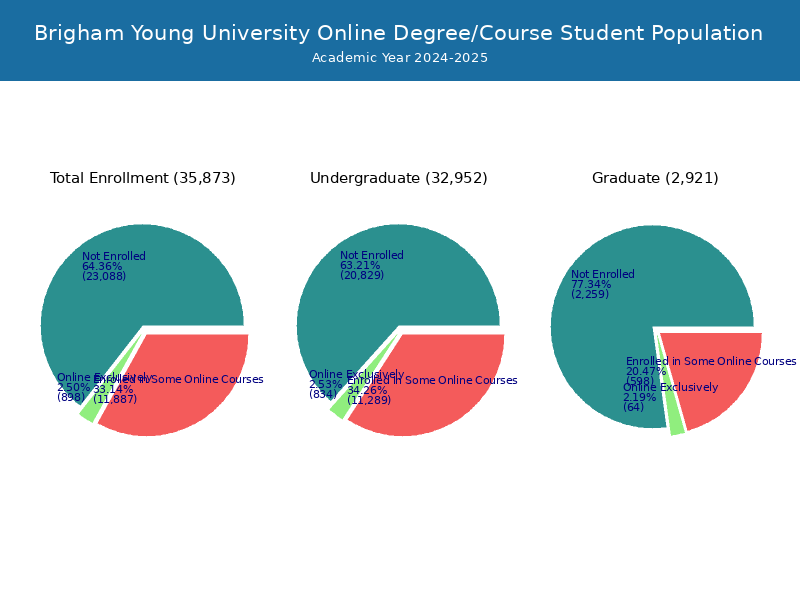
Online Student Enrollment
Distance learning, also called online education, is very attractive to students, especially who want to continue education and work in field. At Brigham Young University, 807 students are enrolled exclusively in online courses and 12,144 students are enrolled in some online courses.
548 students lived in Utah or jurisdiction in which the school is located are enrolled exclusively in online courses and 259 students live in other State or outside of the United States.
| All Students | Enrolled Exclusively Online Courses | Enrolled in Some Online Courses | |
|---|---|---|---|
| All Students | 34,464 | 807 | 12,144 |
| Undergraduate | 31,411 | 692 | 11,602 |
| Graduate | 3,053 | 115 | 542 |
| Utah Residents | Other States in U.S. | Outside of U.S. | |
|---|---|---|---|
| All Students | 548 | 240 | 19 |
| Undergraduate | 451 | 222 | 19 |
| Graduate | 97 | 18 | 0 |
Transfer-in Students (Undergraduate)
Among 31,411 enrolled in undergraduate programs, 991 students have transferred-in from other institutions. The percentage of transfer-in students is 3.15%.872 students have transferred in as full-time status and 119 students transferred in as part-time status.
| Number of Students | |
|---|---|
| Regular Full-time | 27,382 |
| Transfer-in Full-time | 872 |
| Regular Part-time | 3,038 |
| Transfer-in Part-time | 119 |