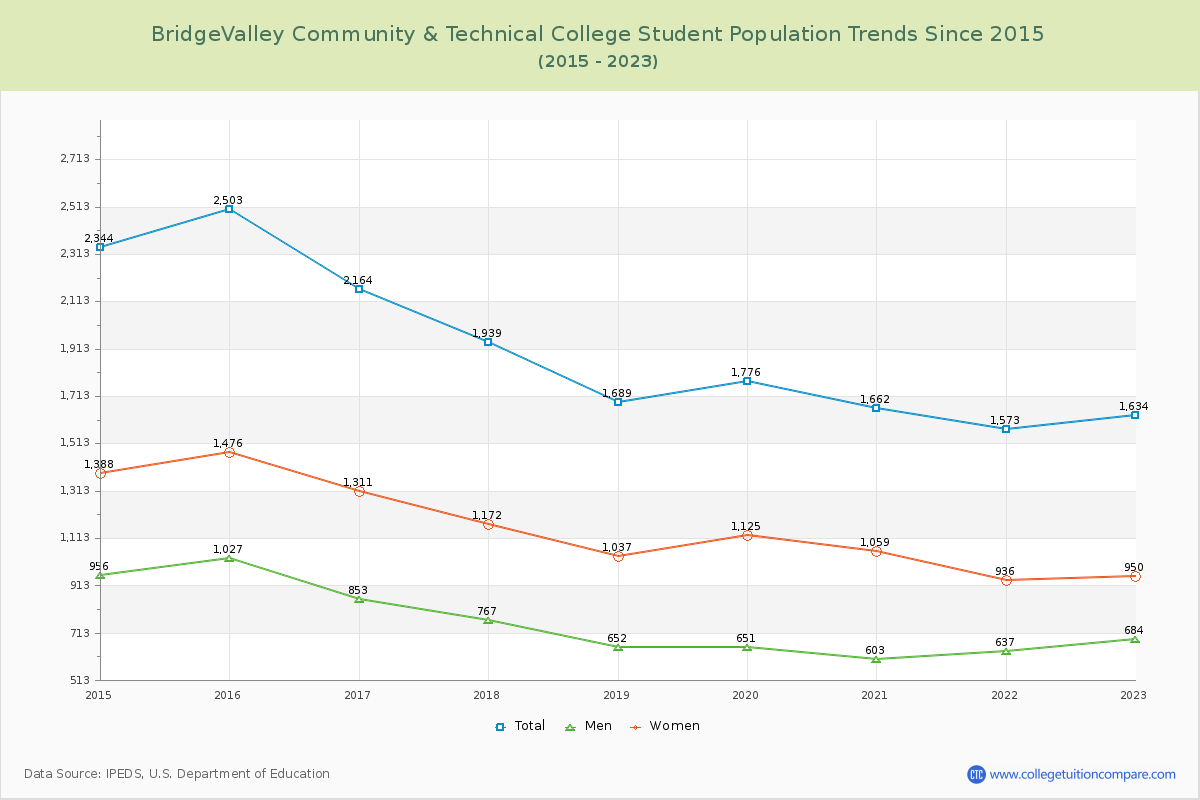
Student Population Changes
The average student population over the last 10 years is 1,920 where 1,634 students are attending the school for the academic year 2022-2023.
The female to male ratio is 1.39 to 1 and it means that there are more female students enrolled in BridgeValley Community & Technical than male students.
The following table and chart illustrate the changes in student population by gender at BridgeValley Community & Technical College since 2014.
| Year | Total | Men | Women |
|---|---|---|---|
| 2014-15 | 2,344 | 956 | 1,388 |
| 2015-16 | 2,503 159 | 1,027 71 | 1,476 88 |
| 2016-17 | 2,164 -339 | 853 -174 | 1,311 -165 |
| 2017-18 | 1,939 -225 | 767 -86 | 1,172 -139 |
| 2018-19 | 1,689 -250 | 652 -115 | 1,037 -135 |
| 2019-20 | 1,776 87 | 651 -1 | 1,125 88 |
| 2020-21 | 1,662 -114 | 603 -48 | 1,059 -66 |
| 2021-22 | 1,573 -89 | 637 34 | 936 -123 |
| 2022-23 | 1,634 61 | 684 47 | 950 14 |
| Average | 1,920 | 759 | 1,162 |