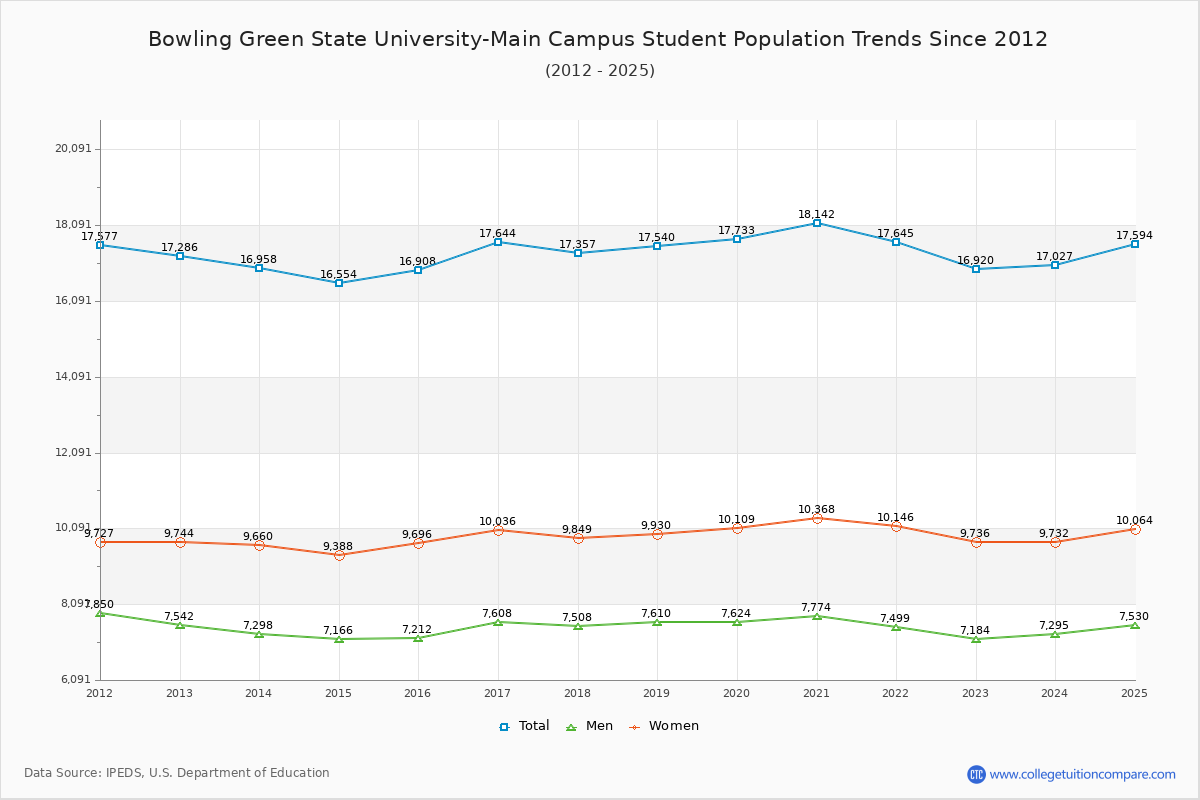
Student Population Changes
The average student population over the last 12 years is 17,335 where 16,920 students are attending the school for the academic year 2022-2023.
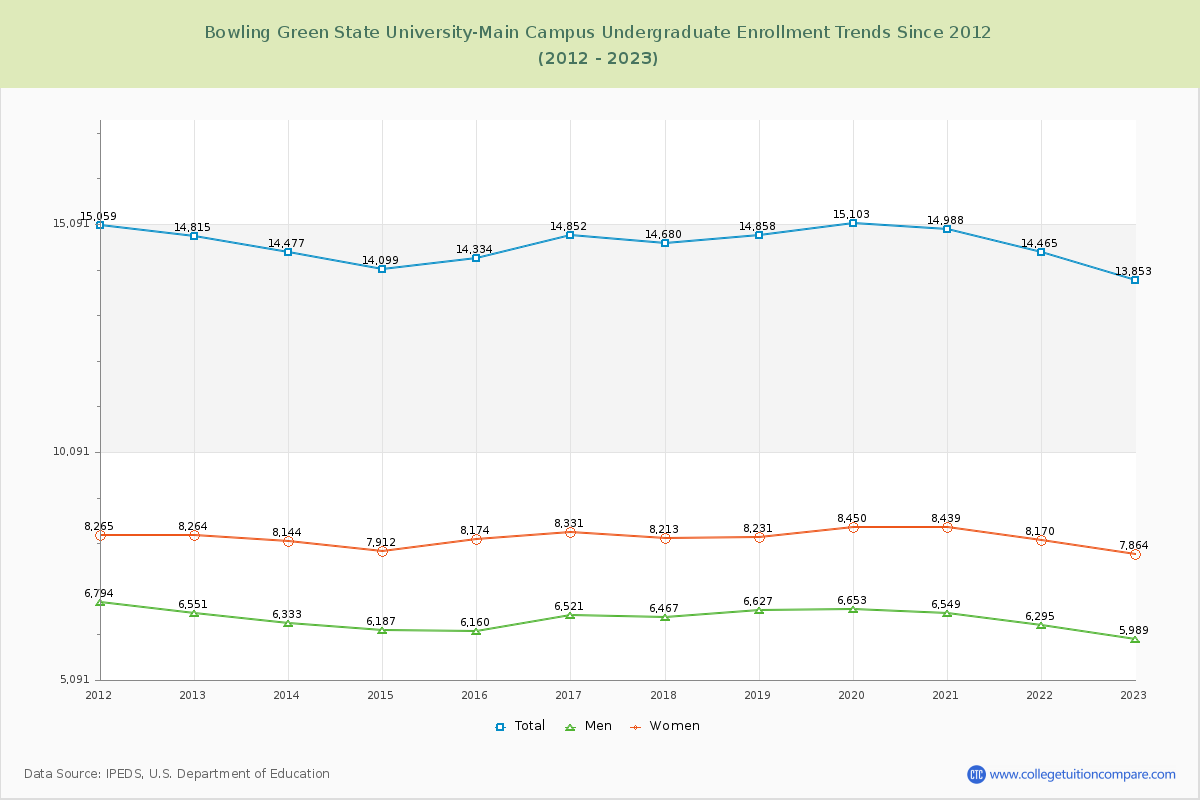
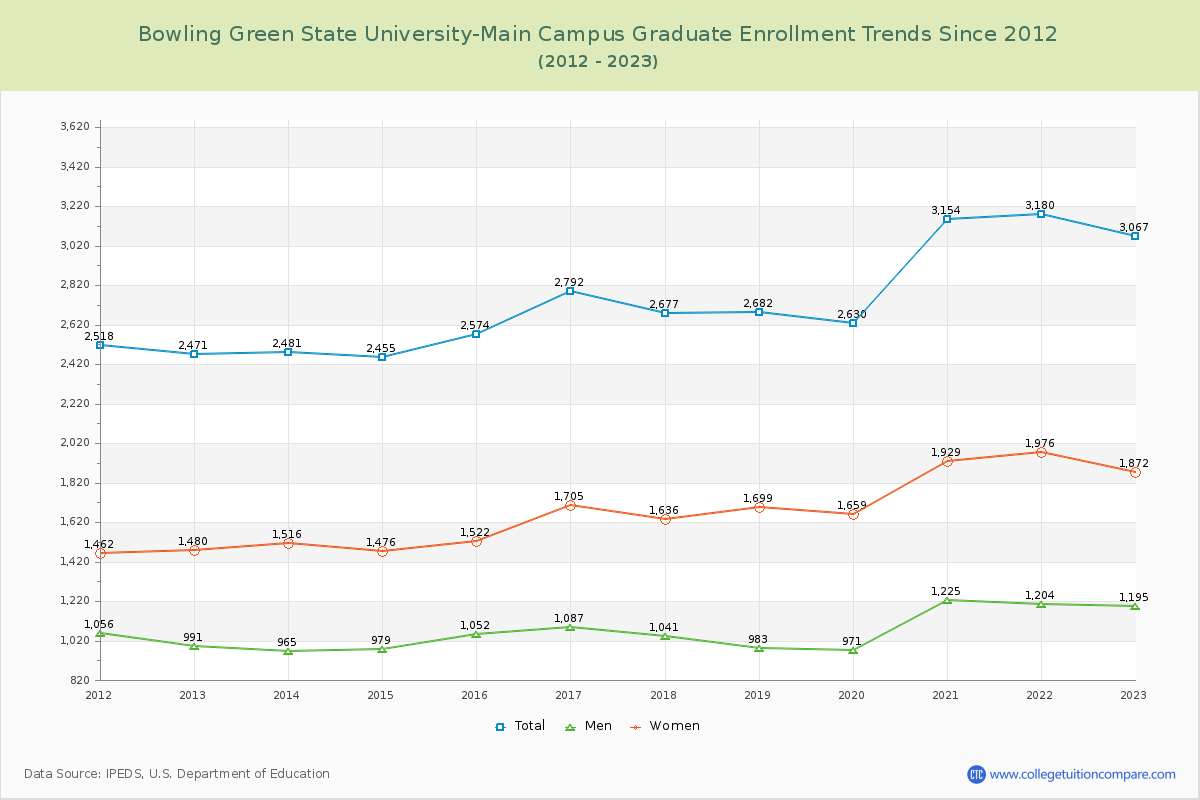
81.87% of total students is undergraduate students and 18.13% students is graduate students. The number of undergraduate students has decreased by 962 and the graduate enrollment has increased by 596 over past 10 years.
The female to male ratio is 1.36 to 1 and it means that there are more female students enrolled in BGSU than male students.
The following table and chart illustrate the changes in student population by gender at Bowling Green State University-Main Campus since 2012.
| Year | Total | Undergraduate | Graduate | ||||
|---|---|---|---|---|---|---|---|
| Total | Men | Women | Total | Men | Women | ||
| 2012-13 | 17,286 | 14,815 | 6,551 | 8,264 | 2,471 | 991 | 1,480 |
| 2013-14 | 16,958 -328 | 14,477 -338 | 6,333 -218 | 8,144 -120 | 2,481 10 | 965 -26 | 1,516 36 |
| 2014-15 | 16,554 -404 | 14,099 -378 | 6,187 -146 | 7,912 -232 | 2,455 -26 | 979 14 | 1,476 -40 |
| 2015-16 | 16,908 354 | 14,334 235 | 6,160 -27 | 8,174 262 | 2,574 119 | 1,052 73 | 1,522 46 |
| 2016-17 | 17,644 736 | 14,852 518 | 6,521 361 | 8,331 157 | 2,792 218 | 1,087 35 | 1,705 183 |
| 2017-18 | 17,357 -287 | 14,680 -172 | 6,467 -54 | 8,213 -118 | 2,677 -115 | 1,041 -46 | 1,636 -69 |
| 2018-19 | 17,540 183 | 14,858 178 | 6,627 160 | 8,231 18 | 2,682 5 | 983 -58 | 1,699 63 |
| 2019-20 | 17,733 193 | 15,103 245 | 6,653 26 | 8,450 219 | 2,630 -52 | 971 -12 | 1,659 -40 |
| 2020-21 | 18,142 409 | 14,988 -115 | 6,549 -104 | 8,439 -11 | 3,154 524 | 1,225 254 | 1,929 270 |
| 2021-22 | 17,645 -497 | 14,465 -523 | 6,295 -254 | 8,170 -269 | 3,180 26 | 1,204 -21 | 1,976 47 |
| 2022-23 | 16,920 -725 | 13,853 -612 | 5,989 -306 | 7,864 -306 | 3,067 -113 | 1,195 -9 | 1,872 -104 |
| Average | 17,335 | 14,593 | 6,394 | 8,199 | 2,742 | 1,063 | 1,679 |