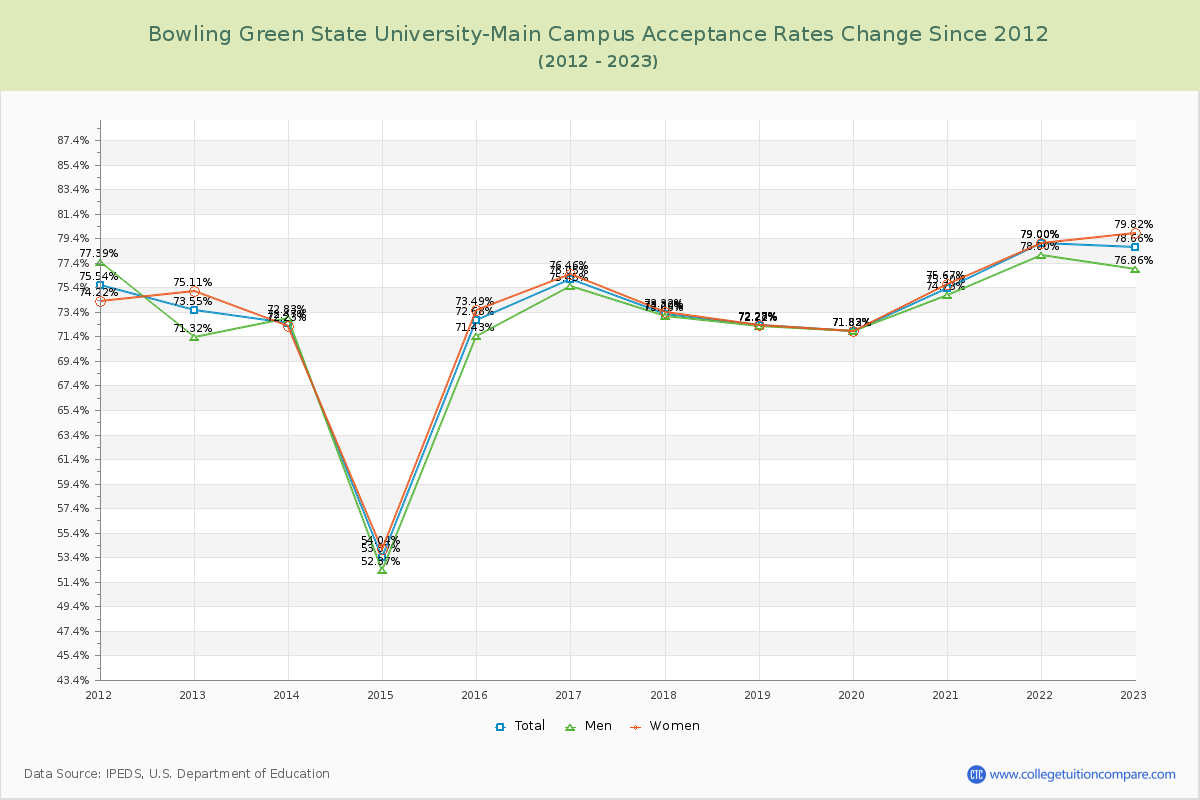
Acceptance Rate Changes
The average acceptance rate over the last 10 years is 72.58%, and this year's acceptance rate is 78.66% at Bowling Green State University-Main Campus. By gender, men students' acceptance rate is 71.82% and women students' rate is 73.02%.
The next table and chart illustrate the acceptance rates changes at Bowling Green State University-Main Campus over the past 11 years (2012-2023).
| Year | Total | Men | Women |
|---|---|---|---|
| 2012-13 | 73.55% | 71.32% | 75.11% |
| 2013-14 | 72.47% -1.08% |
72.83% -2.88% |
72.23% -2.88% |
| 2014-15 | 53.37% -19.10% |
52.37% -18.19% |
54.04% -18.19% |
| 2015-16 | 72.68% 19.32% |
71.43% 19.45% |
73.49% 19.45% |
| 2016-17 | 76.05% 3.37% |
75.45% 2.96% |
76.46% 2.96% |
| 2017-18 | 73.20% -2.85% |
73.03% -3.14% |
73.32% -3.14% |
| 2018-19 | 72.27% -0.93% |
72.22% -1.05% |
72.28% -1.05% |
| 2019-20 | 71.82% -0.45% |
71.83% -0.46% |
71.82% -0.46% |
| 2020-21 | 75.30% 3.48% |
74.73% 3.85% |
75.67% 3.85% |
| 2021-22 | 79.00% 3.70% |
78.00% 3.33% |
79.00% 3.33% |
| 2022-23 | 78.66% -0.34% |
76.86% 0.82% |
79.82% 0.82% |
| Average | 72.58% | 71.82% | 73.02% |