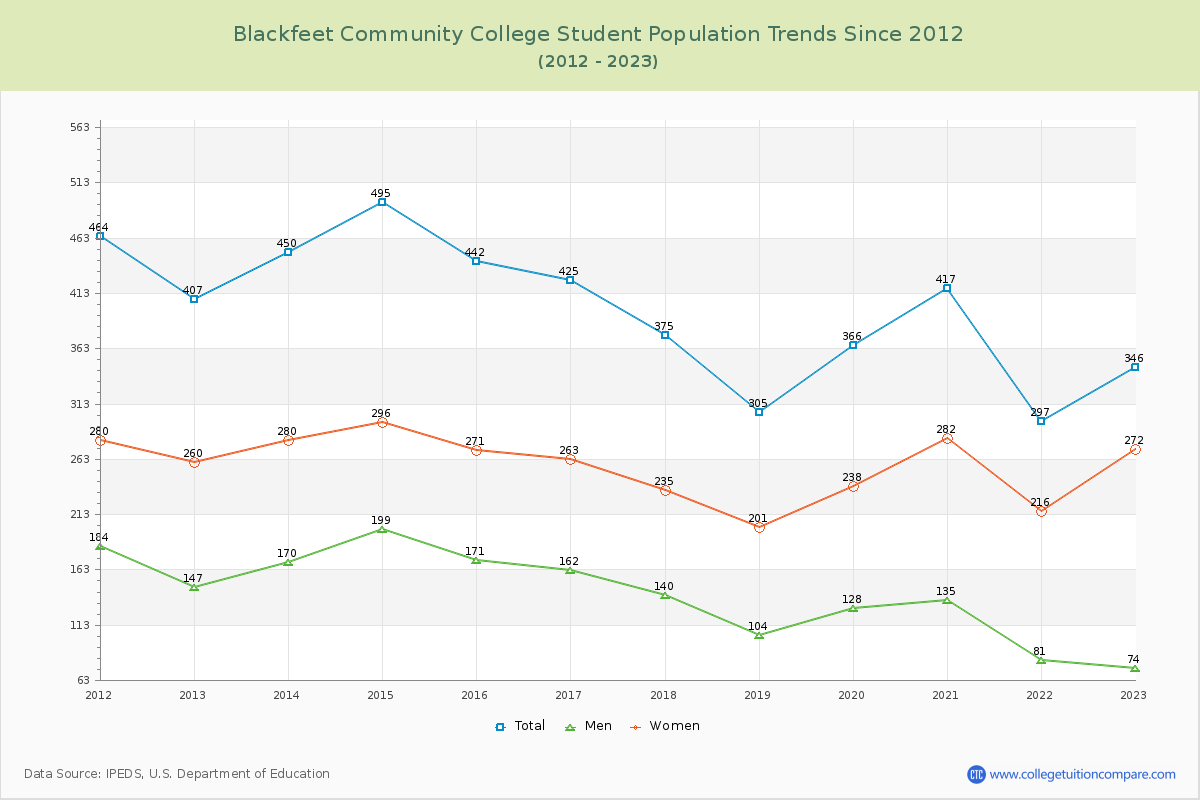
Student Population Changes
The average student population over the last 12 years is 393 where 346 students are attending the school for the academic year 2022-2023.
The female to male ratio is 3.68 to 1 and it means that there are far more female students enrolled in BCC than male students.
The following table and chart illustrate the changes in student population by gender at Blackfeet Community College since 2012.
| Year | Total | Men | Women |
|---|---|---|---|
| 2012-13 | 407 | 147 | 260 |
| 2013-14 | 450 43 | 170 23 | 280 20 |
| 2014-15 | 495 45 | 199 29 | 296 16 |
| 2015-16 | 442 -53 | 171 -28 | 271 -25 |
| 2016-17 | 425 -17 | 162 -9 | 263 -8 |
| 2017-18 | 375 -50 | 140 -22 | 235 -28 |
| 2018-19 | 305 -70 | 104 -36 | 201 -34 |
| 2019-20 | 366 61 | 128 24 | 238 37 |
| 2020-21 | 417 51 | 135 7 | 282 44 |
| 2021-22 | 297 -120 | 81 -54 | 216 -66 |
| 2022-23 | 346 49 | 74 -7 | 272 56 |
| Average | 393 | 137 | 256 |