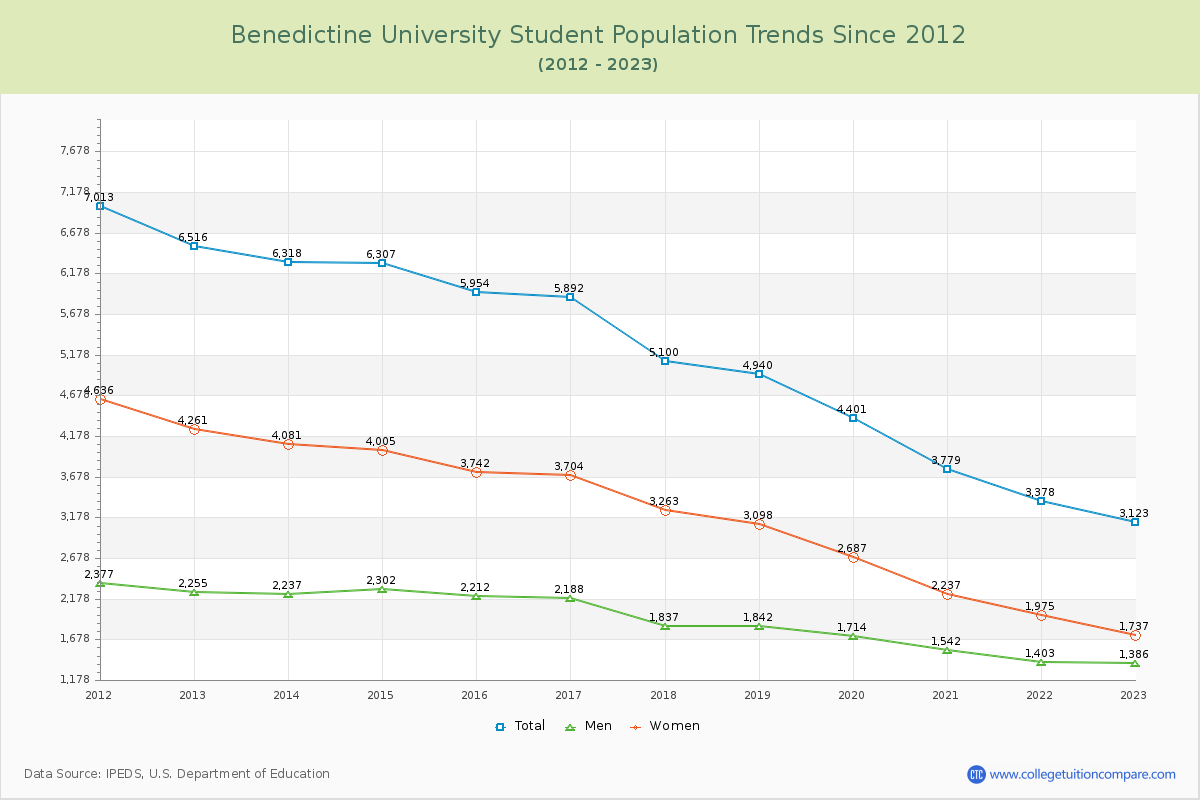
Student Population Changes
The average student population over the last 12 years is 5,064 where 3,123 students are attending the school for the academic year 2022-2023.
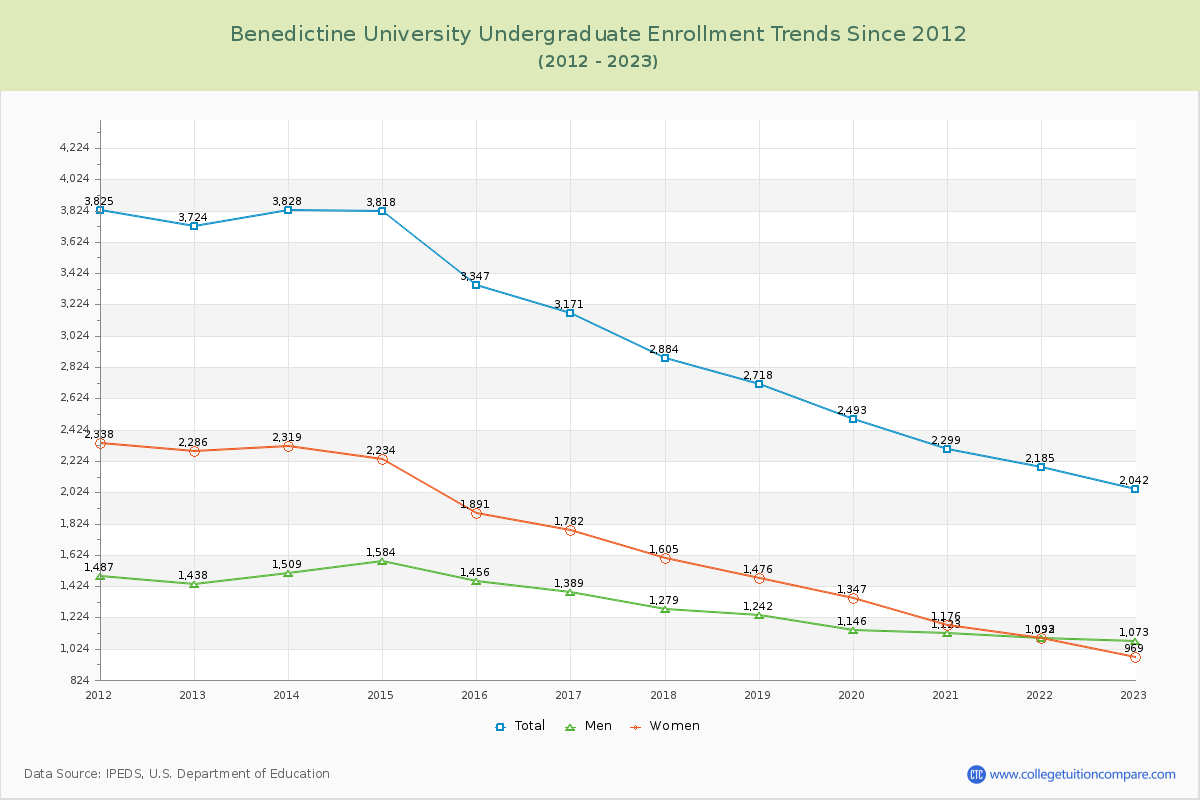
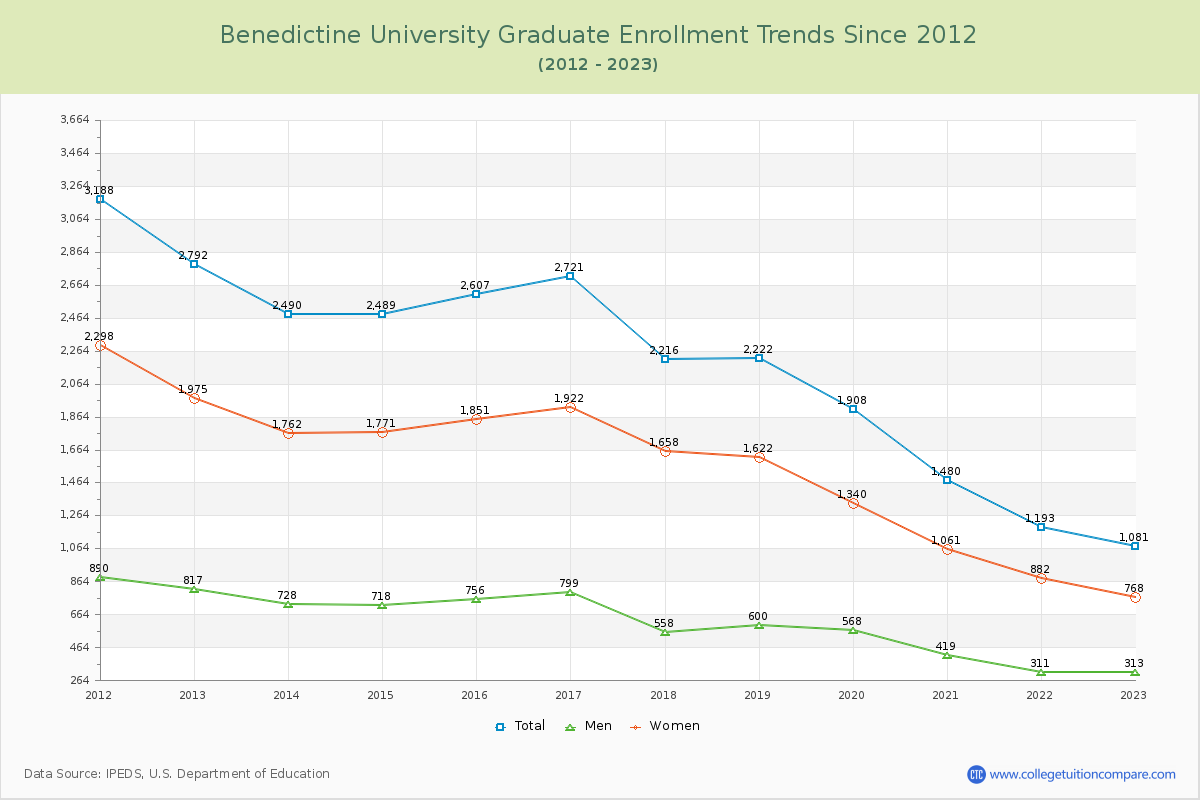
65.39% of total students is undergraduate students and 34.61% students is graduate students. The number of undergraduate students has decreased by 1,682 and the graduate enrollment has decreased by 1,711 over past 10 years.
The female to male ratio is 1.25 to 1 and it means that there are slightly more female students enrolled in Benedictine than male students.
The following table and chart illustrate the changes in student population by gender at Benedictine University since 2012.
| Year | Total | Undergraduate | Graduate | ||||
|---|---|---|---|---|---|---|---|
| Total | Men | Women | Total | Men | Women | ||
| 2012-13 | 6,516 | 3,724 | 1,438 | 2,286 | 2,792 | 817 | 1,975 |
| 2013-14 | 6,318 -198 | 3,828 104 | 1,509 71 | 2,319 33 | 2,490 -302 | 728 -89 | 1,762 -213 |
| 2014-15 | 6,307 -11 | 3,818 -10 | 1,584 75 | 2,234 -85 | 2,489 -1 | 718 -10 | 1,771 9 |
| 2015-16 | 5,954 -353 | 3,347 -471 | 1,456 -128 | 1,891 -343 | 2,607 118 | 756 38 | 1,851 80 |
| 2016-17 | 5,892 -62 | 3,171 -176 | 1,389 -67 | 1,782 -109 | 2,721 114 | 799 43 | 1,922 71 |
| 2017-18 | 5,100 -792 | 2,884 -287 | 1,279 -110 | 1,605 -177 | 2,216 -505 | 558 -241 | 1,658 -264 |
| 2018-19 | 4,940 -160 | 2,718 -166 | 1,242 -37 | 1,476 -129 | 2,222 6 | 600 42 | 1,622 -36 |
| 2019-20 | 4,401 -539 | 2,493 -225 | 1,146 -96 | 1,347 -129 | 1,908 -314 | 568 -32 | 1,340 -282 |
| 2020-21 | 3,779 -622 | 2,299 -194 | 1,123 -23 | 1,176 -171 | 1,480 -428 | 419 -149 | 1,061 -279 |
| 2021-22 | 3,378 -401 | 2,185 -114 | 1,092 -31 | 1,093 -83 | 1,193 -287 | 311 -108 | 882 -179 |
| 2022-23 | 3,123 -255 | 2,042 -143 | 1,073 -19 | 969 -124 | 1,081 -112 | 313 2 | 768 -114 |
| Average | 5,064 | 2,955 | 1,303 | 1,653 | 2,109 | 599 | 1,510 |