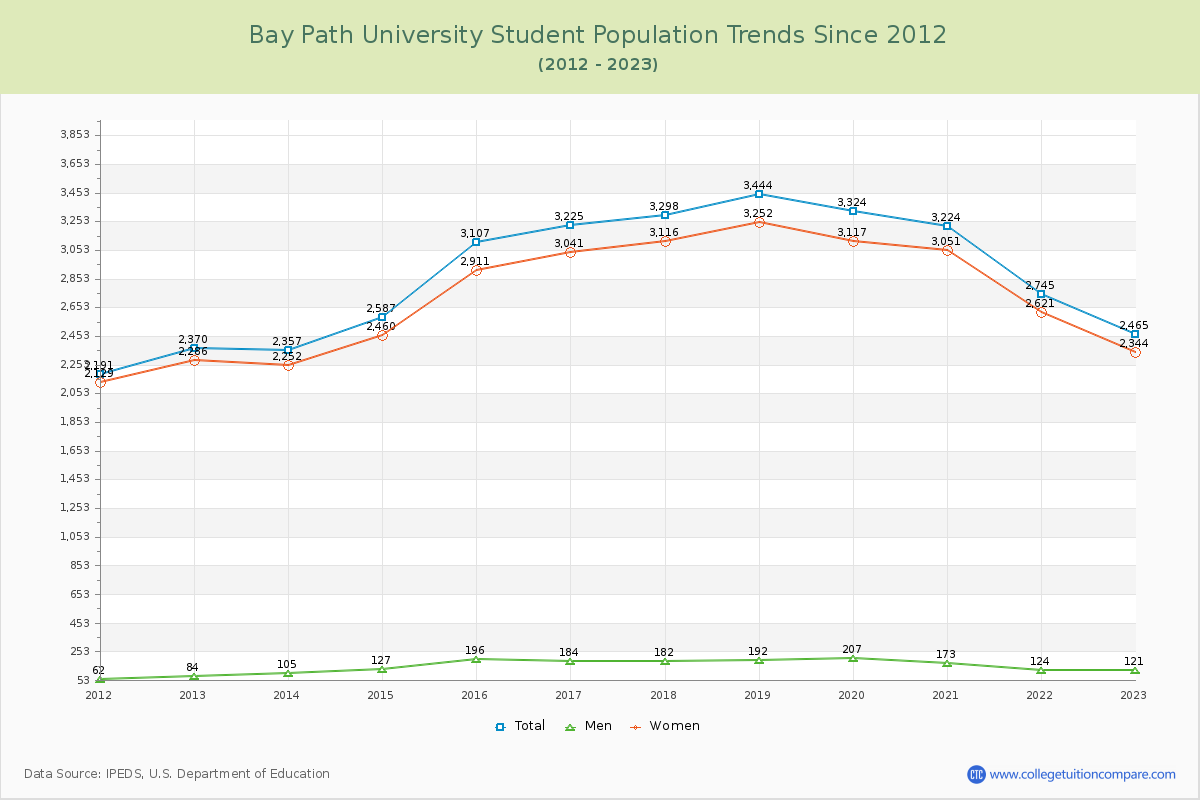
Student Population Changes
The average student population over the last 12 years is 2,922 where 2,465 students are attending the school for the academic year 2022-2023.
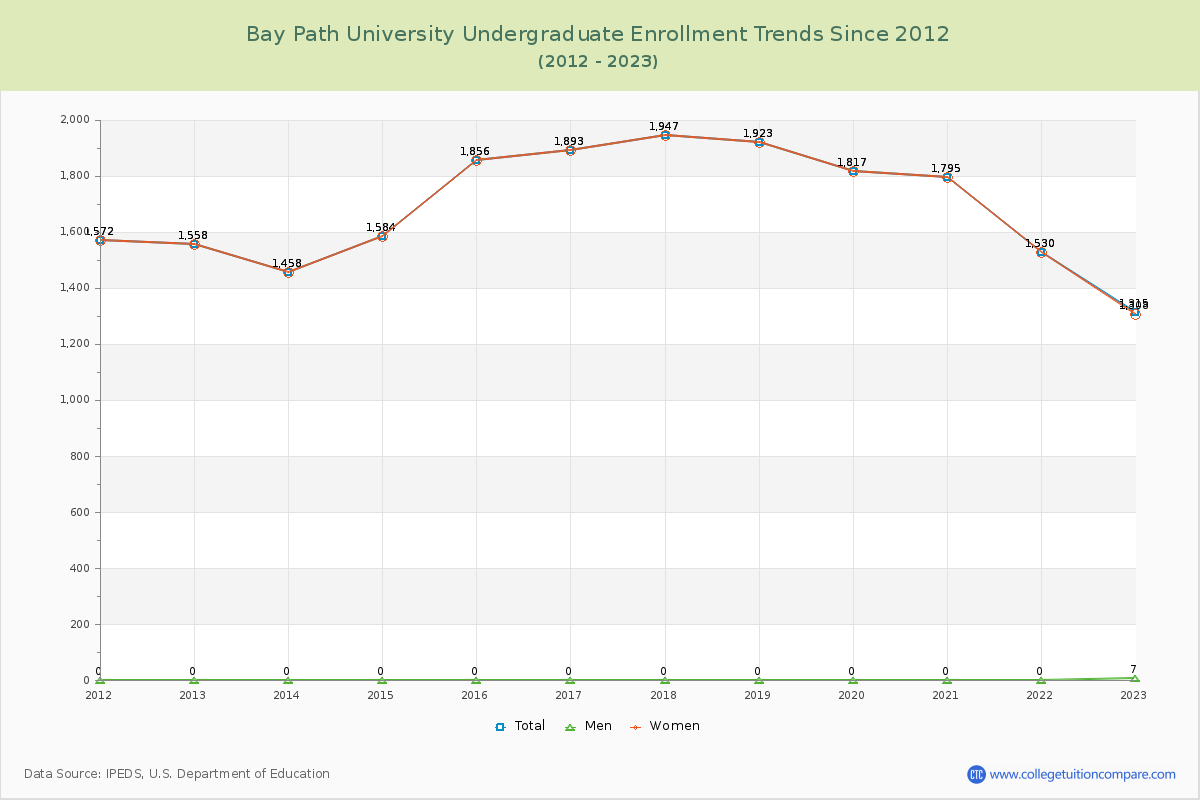
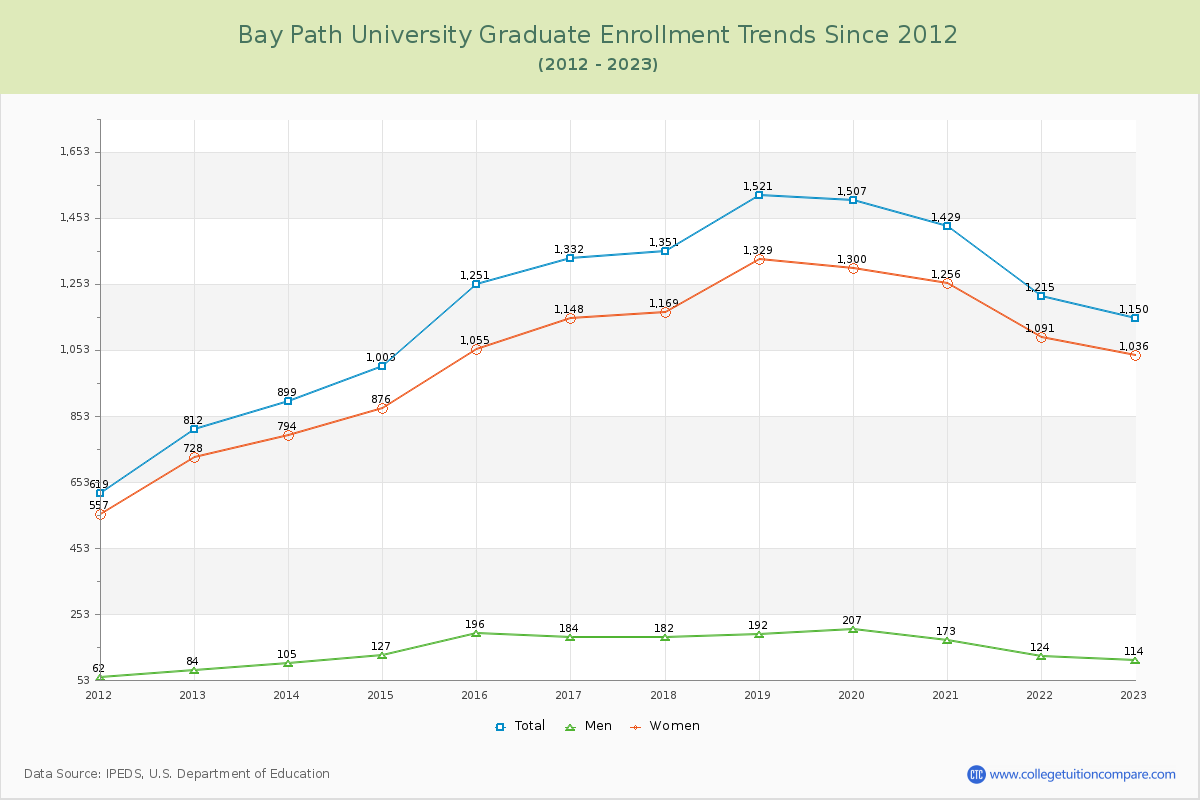
53.35% of total students is undergraduate students and 46.65% students is graduate students. The number of undergraduate students has decreased by 243 and the graduate enrollment has increased by 338 over past 10 years.
The following table and chart illustrate the changes in student population by gender at Bay Path University since 2012.
| Year | Total | Undergraduate | Graduate | ||||
|---|---|---|---|---|---|---|---|
| Total | Men | Women | Total | Men | Women | ||
| 2012-13 | 2,370 | 1,558 | 0 | 1,558 | 812 | 84 | 728 |
| 2013-14 | 2,357 -13 | 1,458 -100 | 0 0 | 1,458 -100 | 899 87 | 105 21 | 794 66 |
| 2014-15 | 2,587 230 | 1,584 126 | 0 0 | 1,584 126 | 1,003 104 | 127 22 | 876 82 |
| 2015-16 | 3,107 520 | 1,856 272 | 0 0 | 1,856 272 | 1,251 248 | 196 69 | 1,055 179 |
| 2016-17 | 3,225 118 | 1,893 37 | 0 0 | 1,893 37 | 1,332 81 | 184 -12 | 1,148 93 |
| 2017-18 | 3,298 73 | 1,947 54 | 0 0 | 1,947 54 | 1,351 19 | 182 -2 | 1,169 21 |
| 2018-19 | 3,444 146 | 1,923 -24 | 0 0 | 1,923 -24 | 1,521 170 | 192 10 | 1,329 160 |
| 2019-20 | 3,324 -120 | 1,817 -106 | 0 0 | 1,817 -106 | 1,507 -14 | 207 15 | 1,300 -29 |
| 2020-21 | 3,224 -100 | 1,795 -22 | 0 0 | 1,795 -22 | 1,429 -78 | 173 -34 | 1,256 -44 |
| 2021-22 | 2,745 -479 | 1,530 -265 | 0 0 | 1,530 -265 | 1,215 -214 | 124 -49 | 1,091 -165 |
| 2022-23 | 2,465 -280 | 1,315 -215 | 7 7 | 1,308 -222 | 1,150 -65 | 114 -10 | 1,036 -55 |
| Average | 2,922 | 1,698 | 1 | 1,697 | 1,225 | 153 | 1,071 |