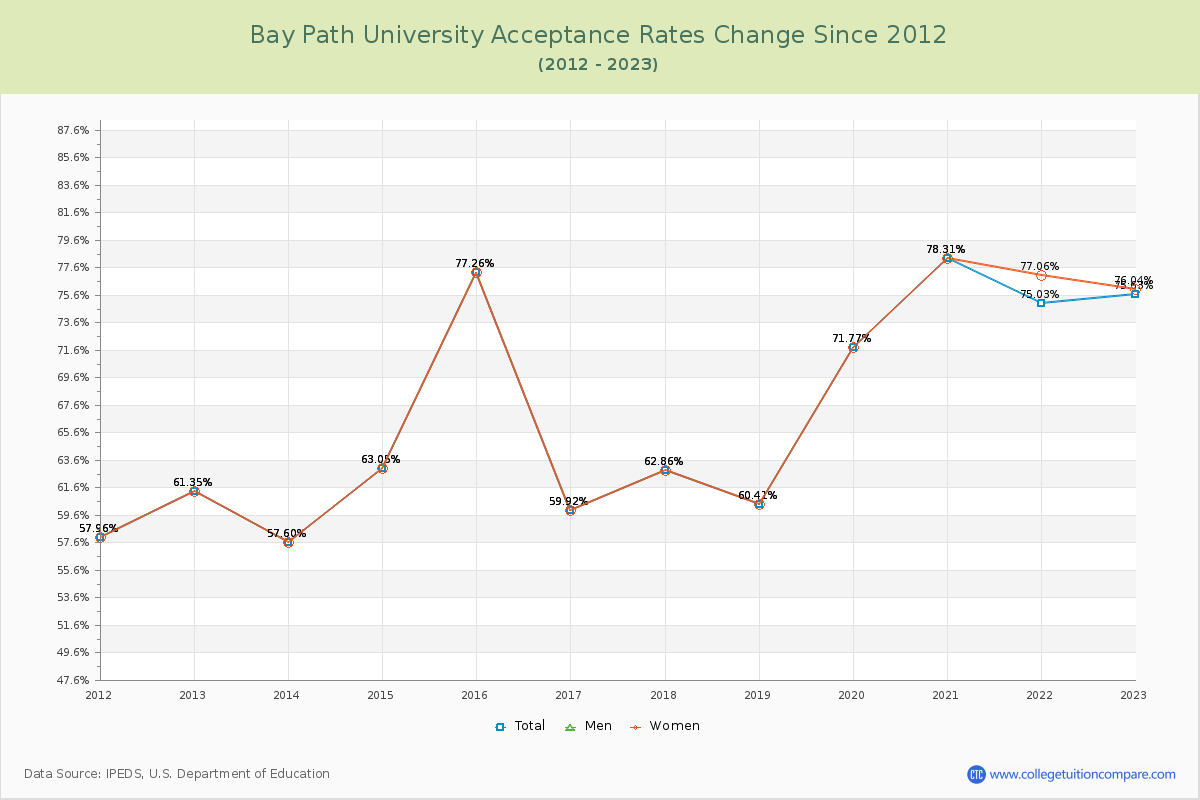
Acceptance Rate Changes
The average acceptance rate over the last 10 years is 67.56%, and this year's acceptance rate is 75.63% at Bay Path University.
The next table and chart illustrate the acceptance rates changes at Bay Path University over the past 11 years (2012-2023).
| Year | Total | Men | Women |
|---|---|---|---|
| 2012-13 | 61.35% | 0.00% | 61.35% |
| 2013-14 | 57.60% -3.75% |
0.00% -3.75% |
57.60% -3.75% |
| 2014-15 | 63.05% 5.45% |
0.00% 5.45% |
63.05% 5.45% |
| 2015-16 | 77.26% 14.22% |
0.00% 14.22% |
77.26% 14.22% |
| 2016-17 | 59.92% -17.34% |
0.00% -17.34% |
59.92% -17.34% |
| 2017-18 | 62.86% 2.93% |
0.00% 2.93% |
62.86% 2.93% |
| 2018-19 | 60.41% -2.45% |
0.00% -2.45% |
60.41% -2.45% |
| 2019-20 | 71.77% 11.36% |
0.00% 11.36% |
71.77% 11.36% |
| 2020-21 | 78.31% 6.54% |
0.00% 6.54% |
78.31% 6.54% |
| 2021-22 | 75.03% -3.28% |
0.00% -1.25% |
77.06% -1.25% |
| 2022-23 | 75.63% 0.60% |
0.00% -1.02% |
76.04% -1.02% |
| Average | 67.56% | 0.00% | 67.78% |