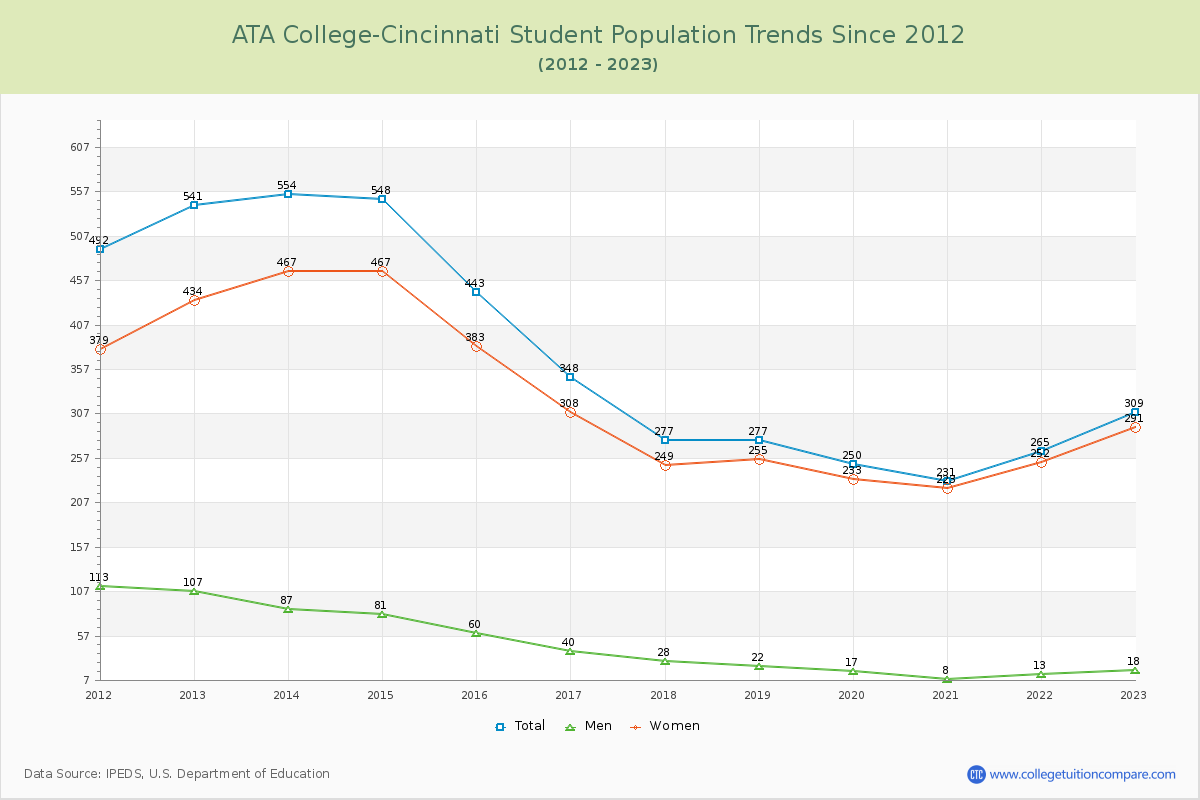
Student Population Changes
The average student population over the last 12 years is 368 where 309 students are attending the school for the academic year 2022-2023.
The female to male ratio is 16.17 to 1 and it means that there are far more female students enrolled in ATA College-Cincinnati than male students.
The following table and chart illustrate the changes in student population by gender at ATA College-Cincinnati since 2012.
| Year | Total | Men | Women |
|---|---|---|---|
| 2012-13 | 541 | 107 | 434 |
| 2013-14 | 554 13 | 87 -20 | 467 33 |
| 2014-15 | 548 -6 | 81 -6 | 467 0 |
| 2015-16 | 443 -105 | 60 -21 | 383 -84 |
| 2016-17 | 348 -95 | 40 -20 | 308 -75 |
| 2017-18 | 277 -71 | 28 -12 | 249 -59 |
| 2018-19 | 277 0 | 22 -6 | 255 6 |
| 2019-20 | 250 -27 | 17 -5 | 233 -22 |
| 2020-21 | 231 -19 | 8 -9 | 223 -10 |
| 2021-22 | 265 34 | 13 5 | 252 29 |
| 2022-23 | 309 44 | 18 5 | 291 39 |
| Average | 368 | 44 | 324 |