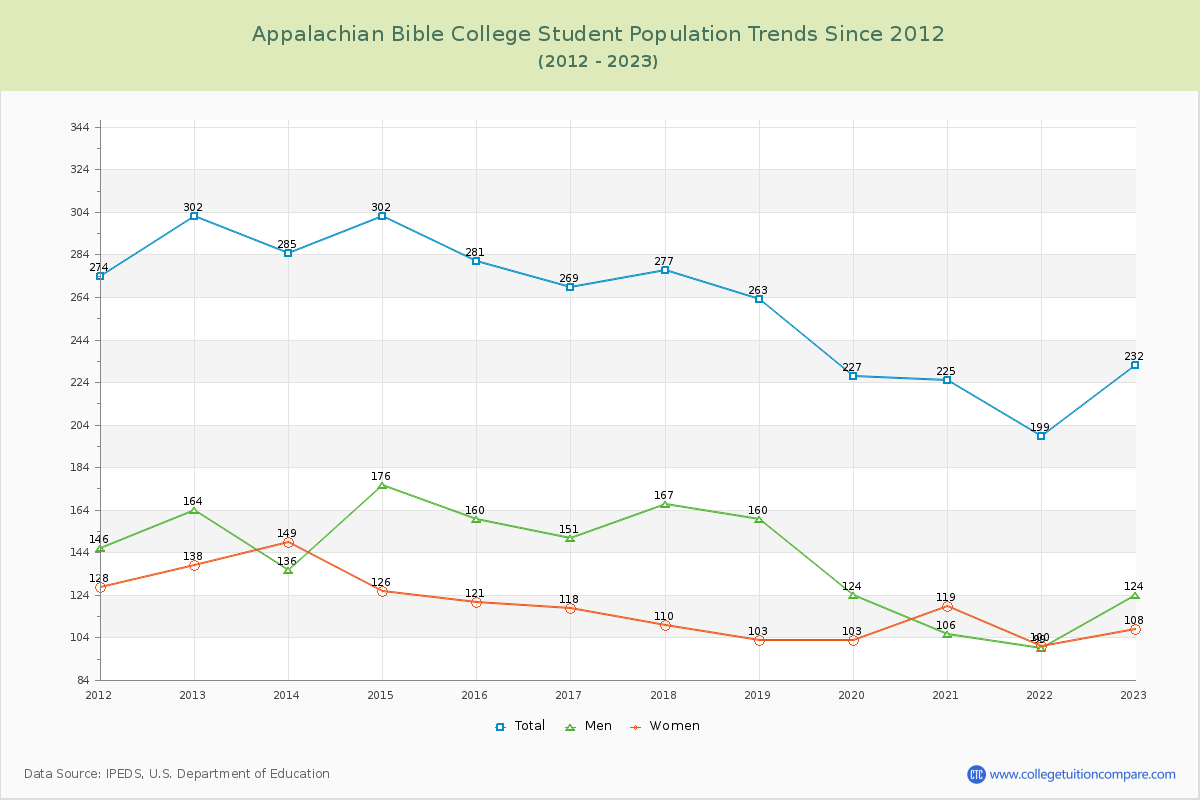
Student Population Changes
The average student population over the last 12 years is 260 where 232 students are attending the school for the academic year 2022-2023.
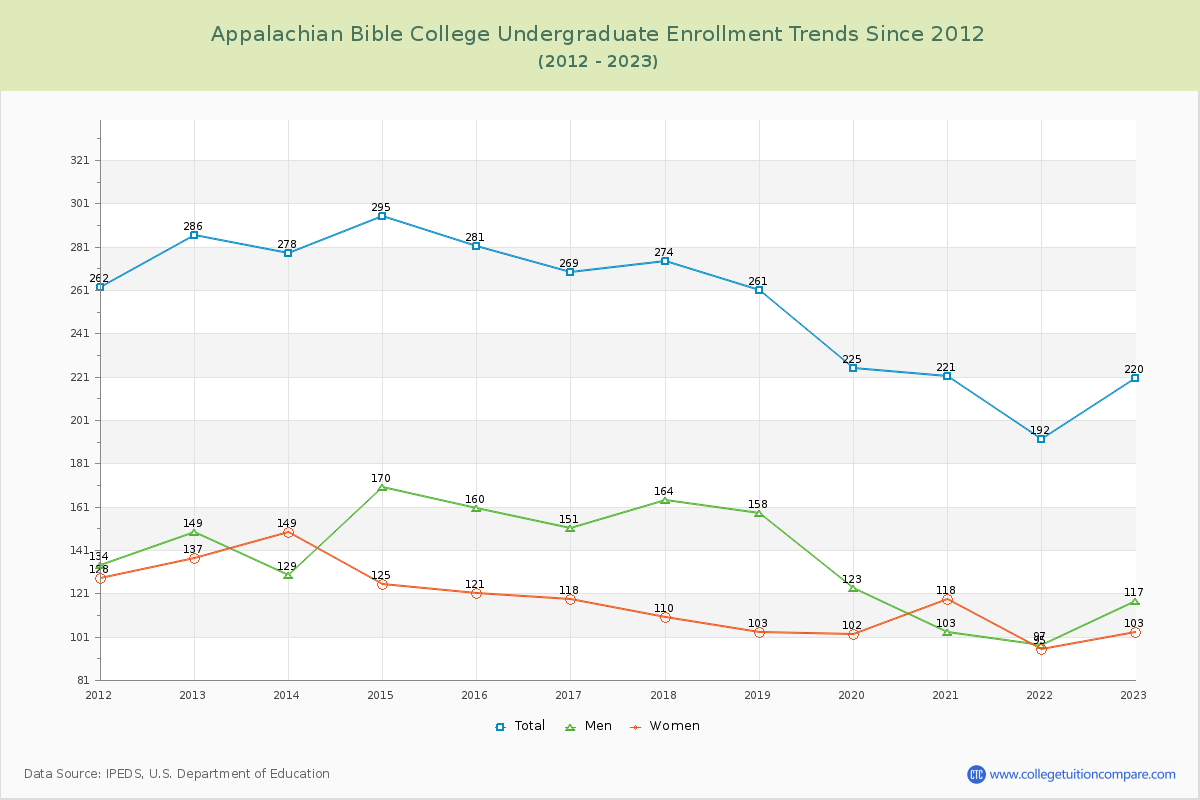
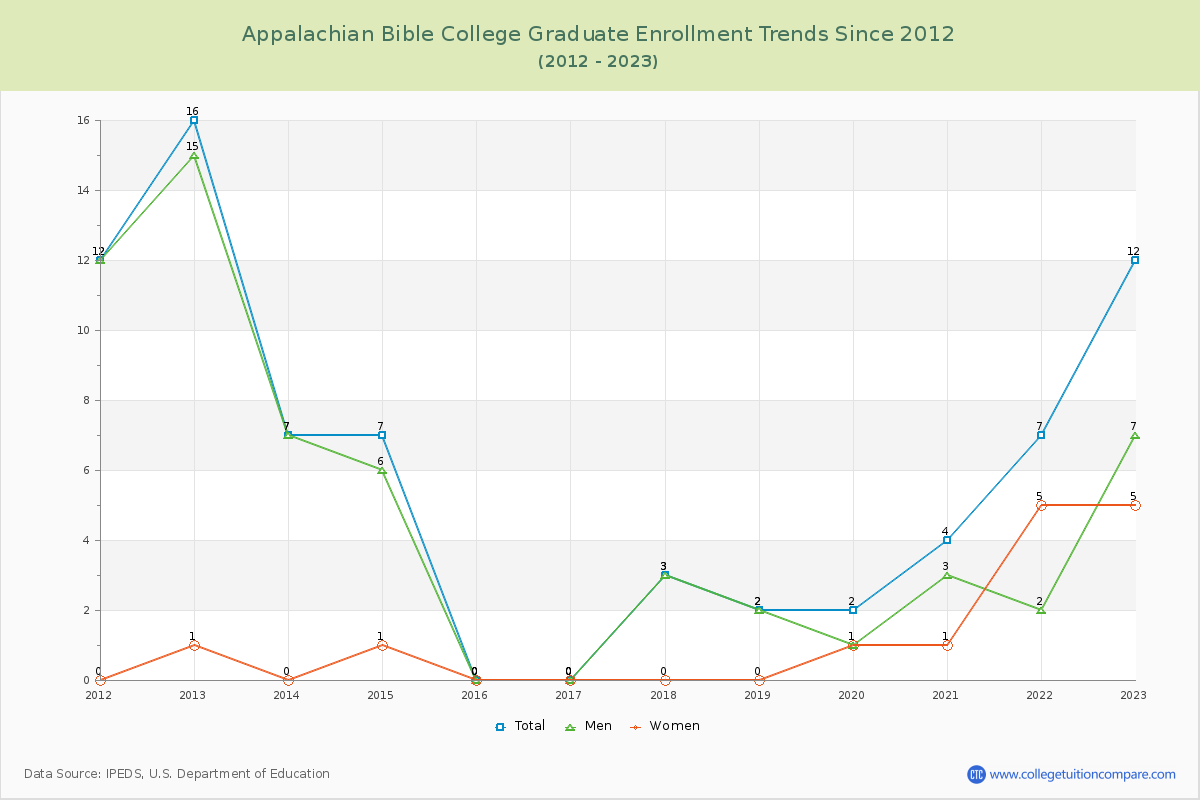
94.83% of total students is undergraduate students and 5.17% students is graduate students. The number of undergraduate students has decreased by 66 and the graduate enrollment has decreased by 4 over past 10 years.
The female to male ratio is 0.87 to 1 and it means that there are slightly more male students enrolled in Appalachian Bible than female students.
The following table and chart illustrate the changes in student population by gender at Appalachian Bible College since 2012.
| Year | Total | Undergraduate | Graduate | ||||
|---|---|---|---|---|---|---|---|
| Total | Men | Women | Total | Men | Women | ||
| 2012-13 | 302 | 286 | 149 | 137 | 16 | 15 | 1 |
| 2013-14 | 285 -17 | 278 -8 | 129 -20 | 149 12 | 7 -9 | 7 -8 | 0 -1 |
| 2014-15 | 302 17 | 295 17 | 170 41 | 125 -24 | 7 0 | 6 -1 | 1 1 |
| 2015-16 | 281 -21 | 281 -14 | 160 -10 | 121 -4 | 0 -7 | 0 -6 | 0 -1 |
| 2016-17 | 269 -12 | 269 -12 | 151 -9 | 118 -3 | 0 0 | 0 0 | 0 0 |
| 2017-18 | 277 8 | 274 5 | 164 13 | 110 -8 | 3 3 | 3 3 | 0 0 |
| 2018-19 | 263 -14 | 261 -13 | 158 -6 | 103 -7 | 2 -1 | 2 -1 | 0 0 |
| 2019-20 | 227 -36 | 225 -36 | 123 -35 | 102 -1 | 2 0 | 1 -1 | 1 1 |
| 2020-21 | 225 -2 | 221 -4 | 103 -20 | 118 16 | 4 2 | 3 2 | 1 0 |
| 2021-22 | 199 -26 | 192 -29 | 97 -6 | 95 -23 | 7 3 | 2 -1 | 5 4 |
| 2022-23 | 232 33 | 220 28 | 117 20 | 103 8 | 12 5 | 7 5 | 5 0 |
| Average | 260 | 255 | 138 | 116 | 5 | 4 | 1 |