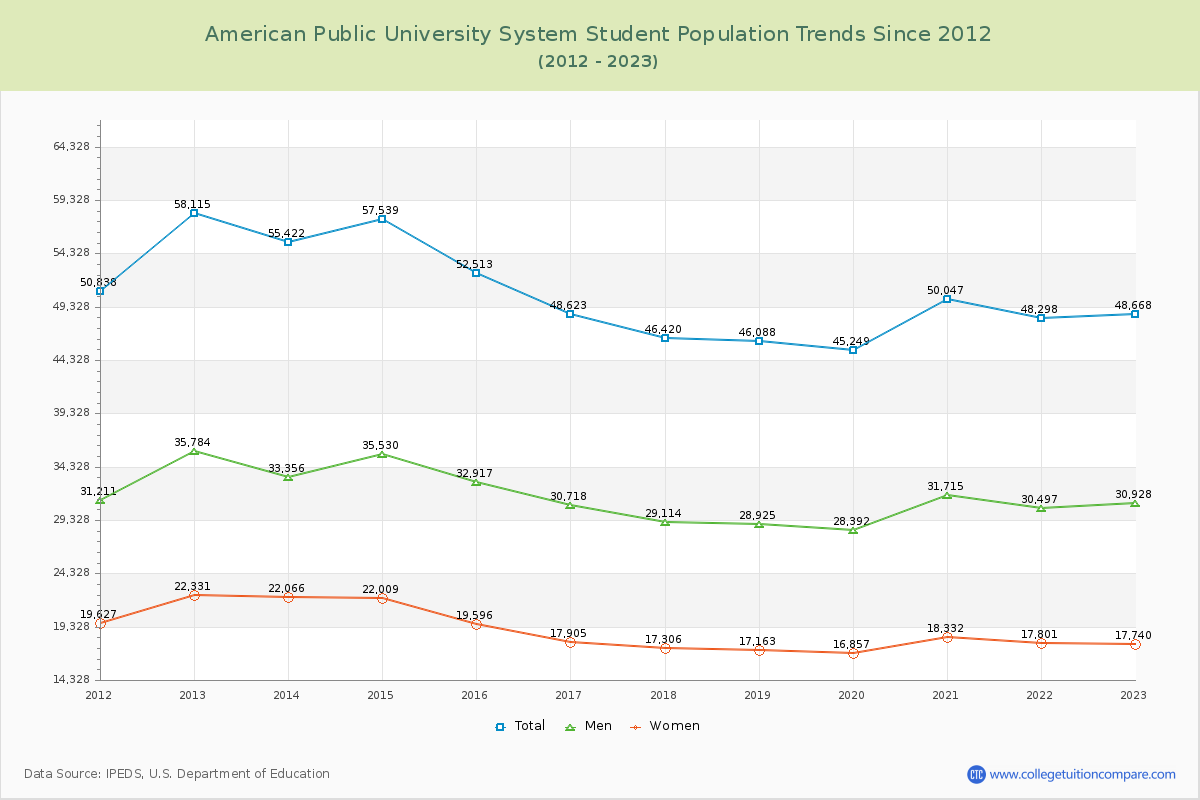
Student Population Changes
The average student population over the last 12 years is 50,635 where 48,668 students are attending the school for the academic year 2022-2023.
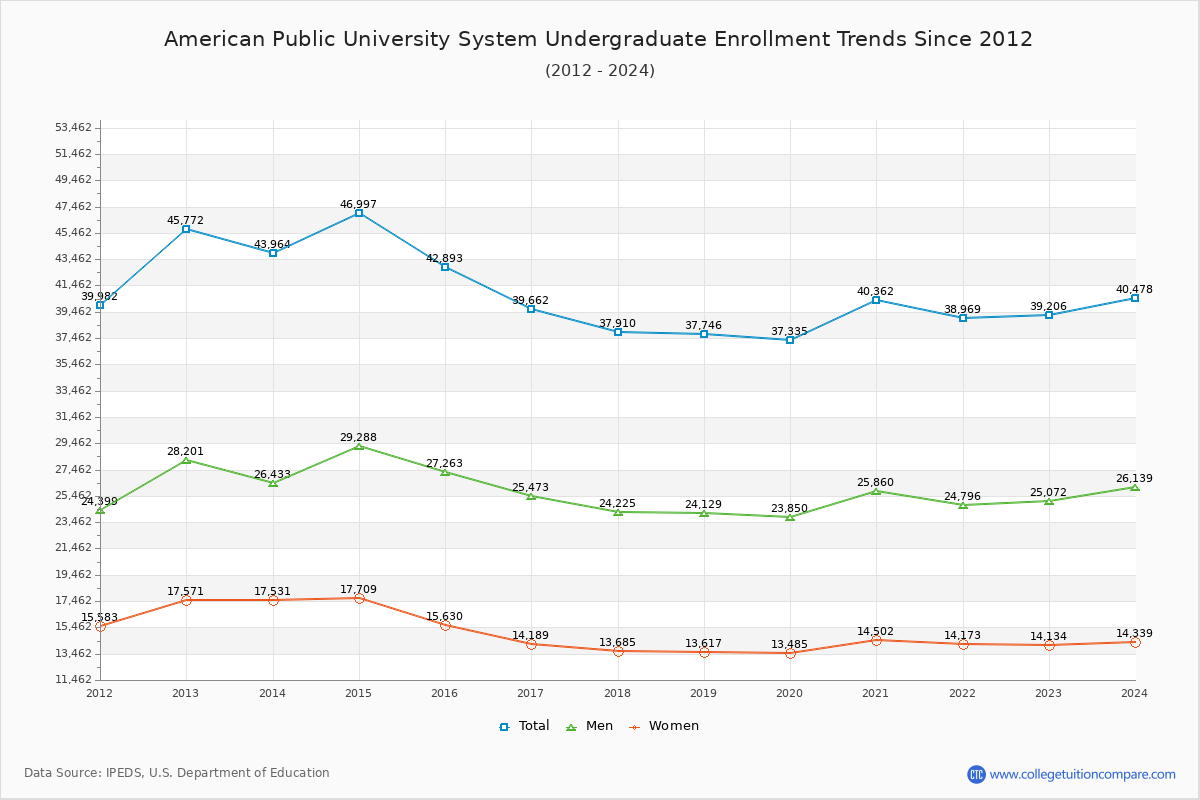
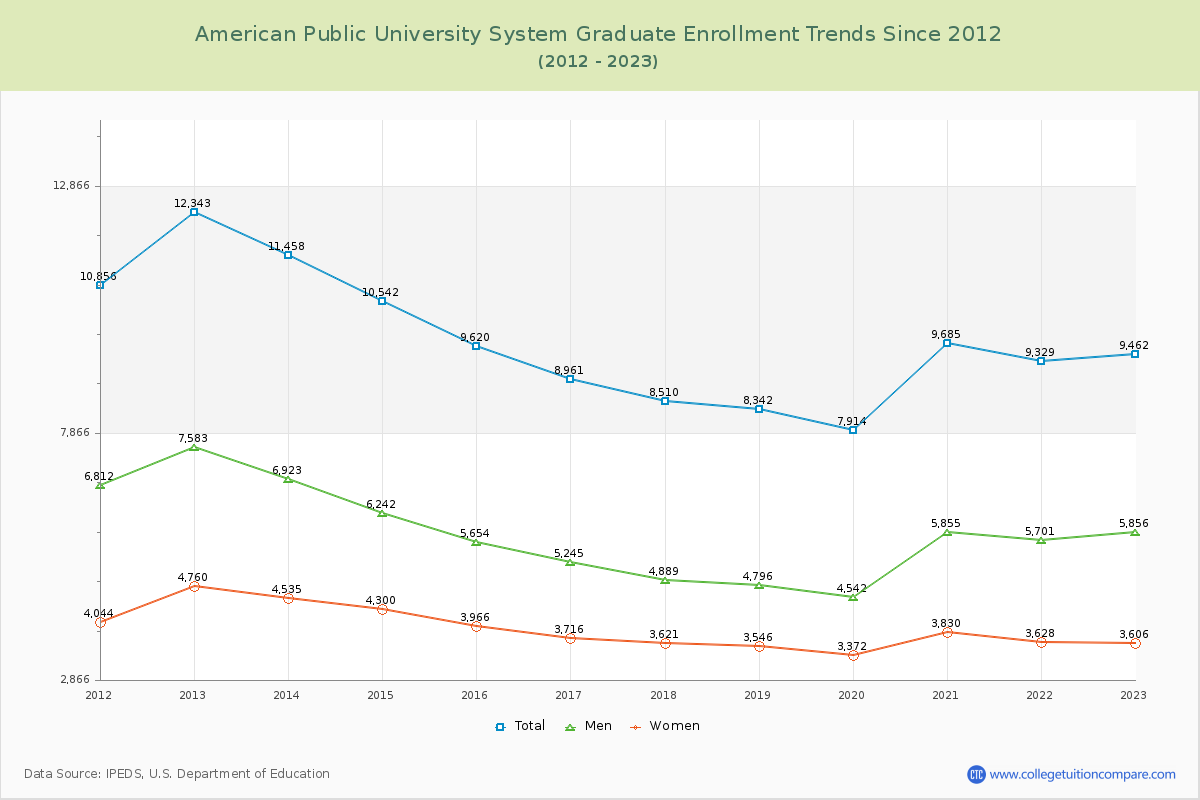
80.56% of total students is undergraduate students and 19.44% students is graduate students. The number of undergraduate students has decreased by 6,566 and the graduate enrollment has decreased by 2,881 over past 10 years.
The female to male ratio is 0.57 to 1 and it means that there are more male students enrolled in American Public University System than female students.
The following table and chart illustrate the changes in student population by gender at American Public University System since 2012.
| Year | Total | Undergraduate | Graduate | ||||
|---|---|---|---|---|---|---|---|
| Total | Men | Women | Total | Men | Women | ||
| 2012-13 | 58,115 | 45,772 | 28,201 | 17,571 | 12,343 | 7,583 | 4,760 |
| 2013-14 | 55,422 -2,693 | 43,964 -1,808 | 26,433 -1,768 | 17,531 -40 | 11,458 -885 | 6,923 -660 | 4,535 -225 |
| 2014-15 | 57,539 2,117 | 46,997 3,033 | 29,288 2,855 | 17,709 178 | 10,542 -916 | 6,242 -681 | 4,300 -235 |
| 2015-16 | 52,513 -5,026 | 42,893 -4,104 | 27,263 -2,025 | 15,630 -2,079 | 9,620 -922 | 5,654 -588 | 3,966 -334 |
| 2016-17 | 48,623 -3,890 | 39,662 -3,231 | 25,473 -1,790 | 14,189 -1,441 | 8,961 -659 | 5,245 -409 | 3,716 -250 |
| 2017-18 | 46,420 -2,203 | 37,910 -1,752 | 24,225 -1,248 | 13,685 -504 | 8,510 -451 | 4,889 -356 | 3,621 -95 |
| 2018-19 | 46,088 -332 | 37,746 -164 | 24,129 -96 | 13,617 -68 | 8,342 -168 | 4,796 -93 | 3,546 -75 |
| 2019-20 | 45,249 -839 | 37,335 -411 | 23,850 -279 | 13,485 -132 | 7,914 -428 | 4,542 -254 | 3,372 -174 |
| 2020-21 | 50,047 4,798 | 40,362 3,027 | 25,860 2,010 | 14,502 1,017 | 9,685 1,771 | 5,855 1,313 | 3,830 458 |
| 2021-22 | 48,298 -1,749 | 38,969 -1,393 | 24,796 -1,064 | 14,173 -329 | 9,329 -356 | 5,701 -154 | 3,628 -202 |
| 2022-23 | 48,668 370 | 39,206 237 | 25,072 276 | 14,134 -39 | 9,462 133 | 5,856 155 | 3,606 -22 |
| Average | 50,635 | 40,983 | 25,872 | 15,111 | 9,651 | 5,753 | 3,898 |