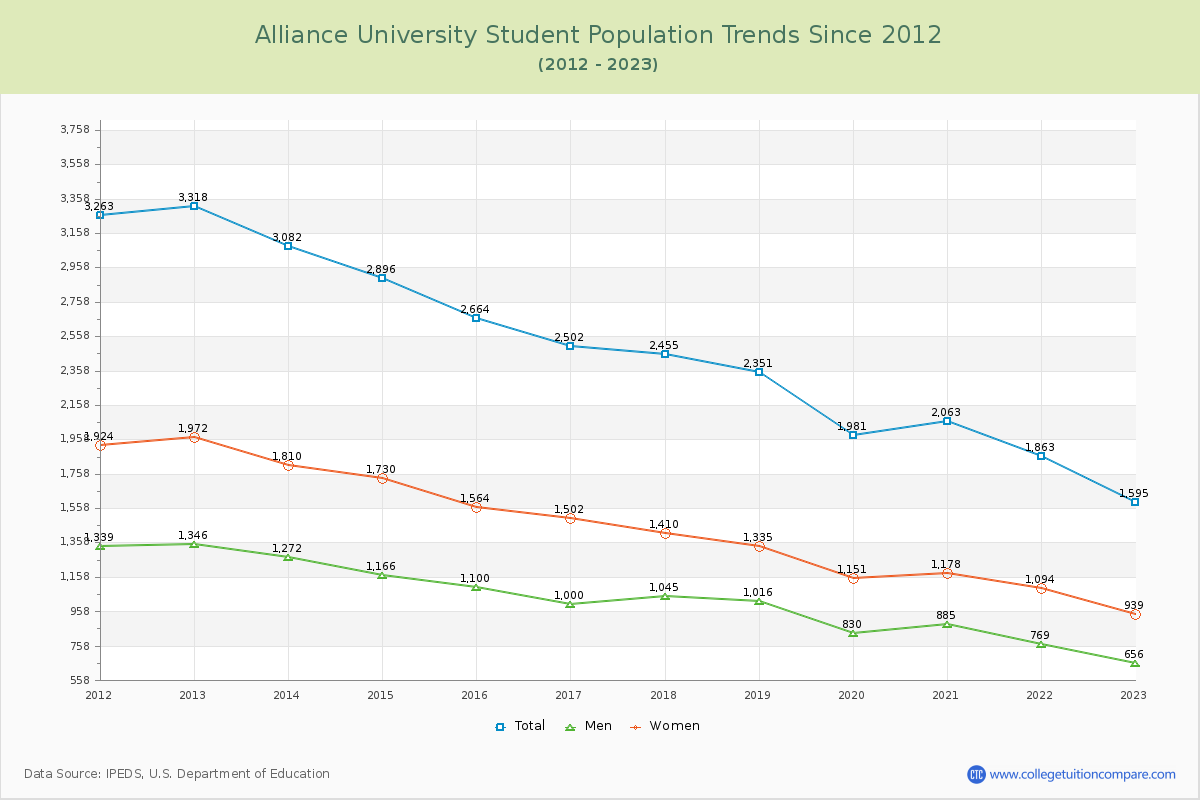
Student Population Changes
The average student population over the last 12 years is 2,434 where 1,595 students are attending the school for the academic year 2022-2023.
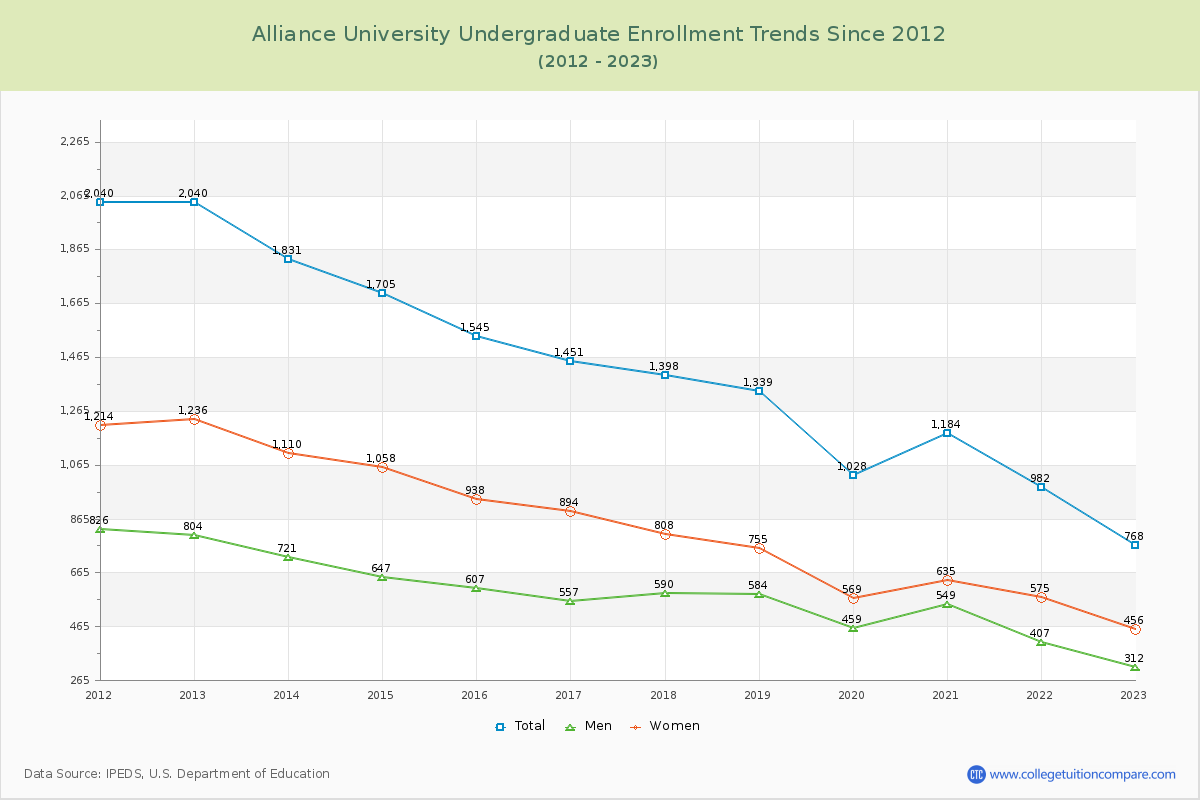
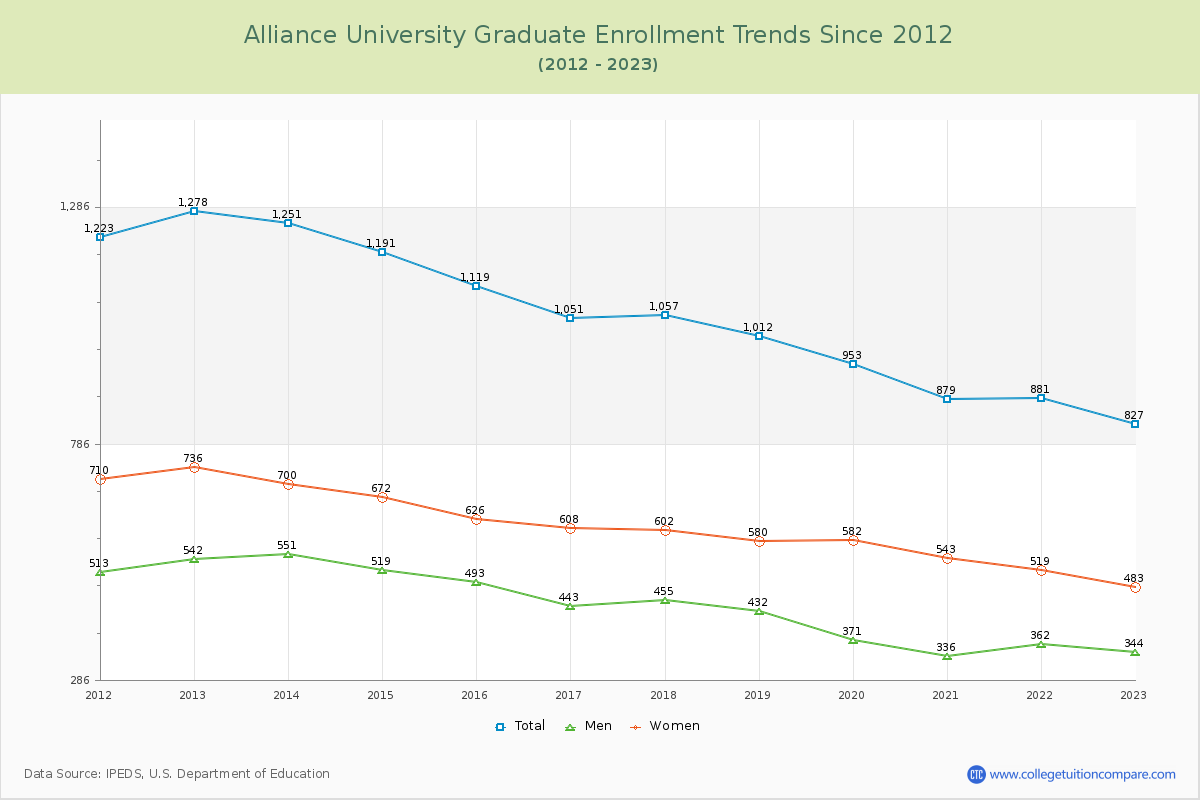
48.15% of total students is undergraduate students and 51.85% students is graduate students. The number of undergraduate students has decreased by 1,272 and the graduate enrollment has decreased by 451 over past 10 years.
The female to male ratio is 1.43 to 1 and it means that there are more female students enrolled in Alliance than male students.
The following table and chart illustrate the changes in student population by gender at Alliance University since 2012.
| Year | Total | Undergraduate | Graduate | ||||
|---|---|---|---|---|---|---|---|
| Total | Men | Women | Total | Men | Women | ||
| 2012-13 | 3,318 | 2,040 | 804 | 1,236 | 1,278 | 542 | 736 |
| 2013-14 | 3,082 -236 | 1,831 -209 | 721 -83 | 1,110 -126 | 1,251 -27 | 551 9 | 700 -36 |
| 2014-15 | 2,896 -186 | 1,705 -126 | 647 -74 | 1,058 -52 | 1,191 -60 | 519 -32 | 672 -28 |
| 2015-16 | 2,664 -232 | 1,545 -160 | 607 -40 | 938 -120 | 1,119 -72 | 493 -26 | 626 -46 |
| 2016-17 | 2,502 -162 | 1,451 -94 | 557 -50 | 894 -44 | 1,051 -68 | 443 -50 | 608 -18 |
| 2017-18 | 2,455 -47 | 1,398 -53 | 590 33 | 808 -86 | 1,057 6 | 455 12 | 602 -6 |
| 2018-19 | 2,351 -104 | 1,339 -59 | 584 -6 | 755 -53 | 1,012 -45 | 432 -23 | 580 -22 |
| 2019-20 | 1,981 -370 | 1,028 -311 | 459 -125 | 569 -186 | 953 -59 | 371 -61 | 582 2 |
| 2020-21 | 2,063 82 | 1,184 156 | 549 90 | 635 66 | 879 -74 | 336 -35 | 543 -39 |
| 2021-22 | 1,863 -200 | 982 -202 | 407 -142 | 575 -60 | 881 2 | 362 26 | 519 -24 |
| 2022-23 | 1,595 -268 | 768 -214 | 312 -95 | 456 -119 | 827 -54 | 344 -18 | 483 -36 |
| Average | 2,434 | 1,388 | 567 | 821 | 1,045 | 441 | 605 |