Student Population Changes
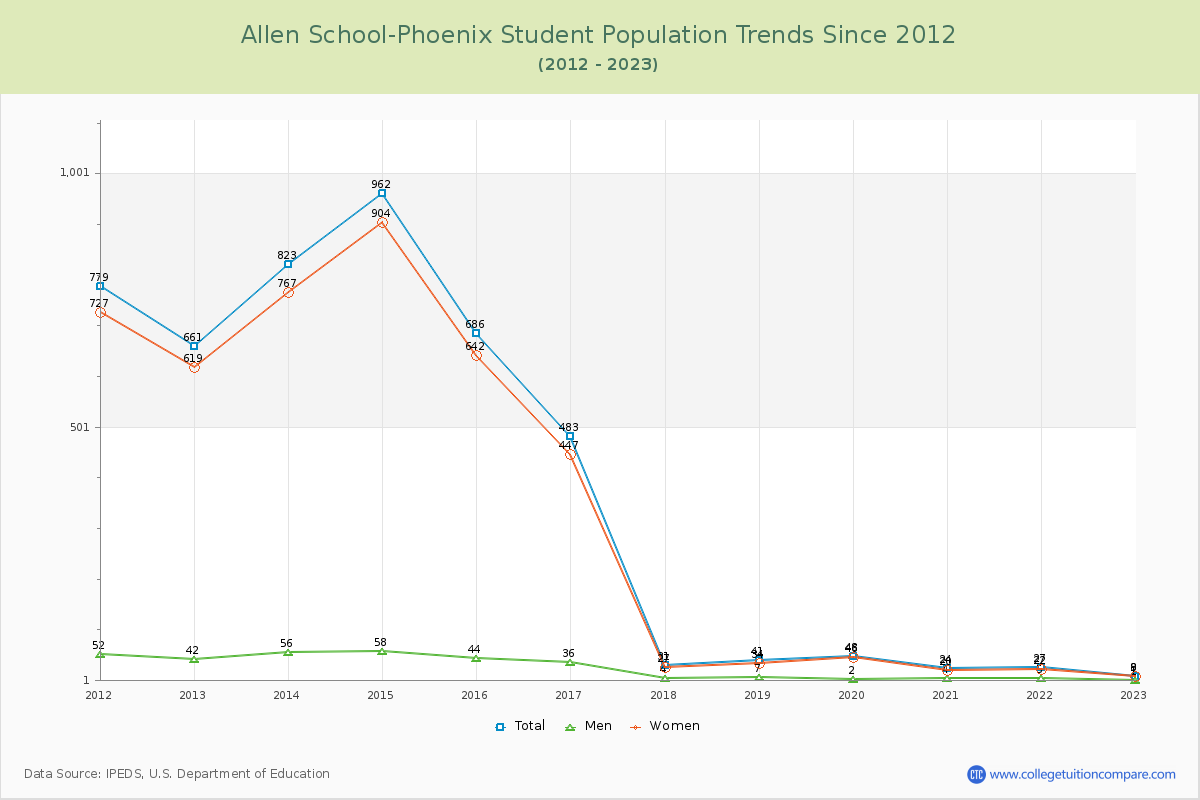
The average student population over the last 12 years is 345 where 9 students are attending the school for the academic year 2022-2023.
The female to male ratio is 8.00 to 1 and it means that there are far more female students enrolled in Allen School-Phoenix than male students.
The following table and chart illustrate the changes in student population by gender at Allen School-Phoenix since 2012.
| Year | Total | Men | Women |
|---|---|---|---|
| 2012-13 | 661 | 42 | 619 |
| 2013-14 | 823 162 | 56 14 | 767 148 |
| 2014-15 | 962 139 | 58 2 | 904 137 |
| 2015-16 | 686 -276 | 44 -14 | 642 -262 |
| 2016-17 | 483 -203 | 36 -8 | 447 -195 |
| 2017-18 | 31 -452 | 4 -32 | 27 -420 |
| 2018-19 | 41 10 | 7 3 | 34 7 |
| 2019-20 | 48 7 | 2 -5 | 46 12 |
| 2020-21 | 24 -24 | 4 2 | 20 -26 |
| 2021-22 | 27 3 | 5 1 | 22 2 |
| 2022-23 | 9 -18 | 1 -4 | 8 -14 |
| Average | 345 | 24 | 321 |