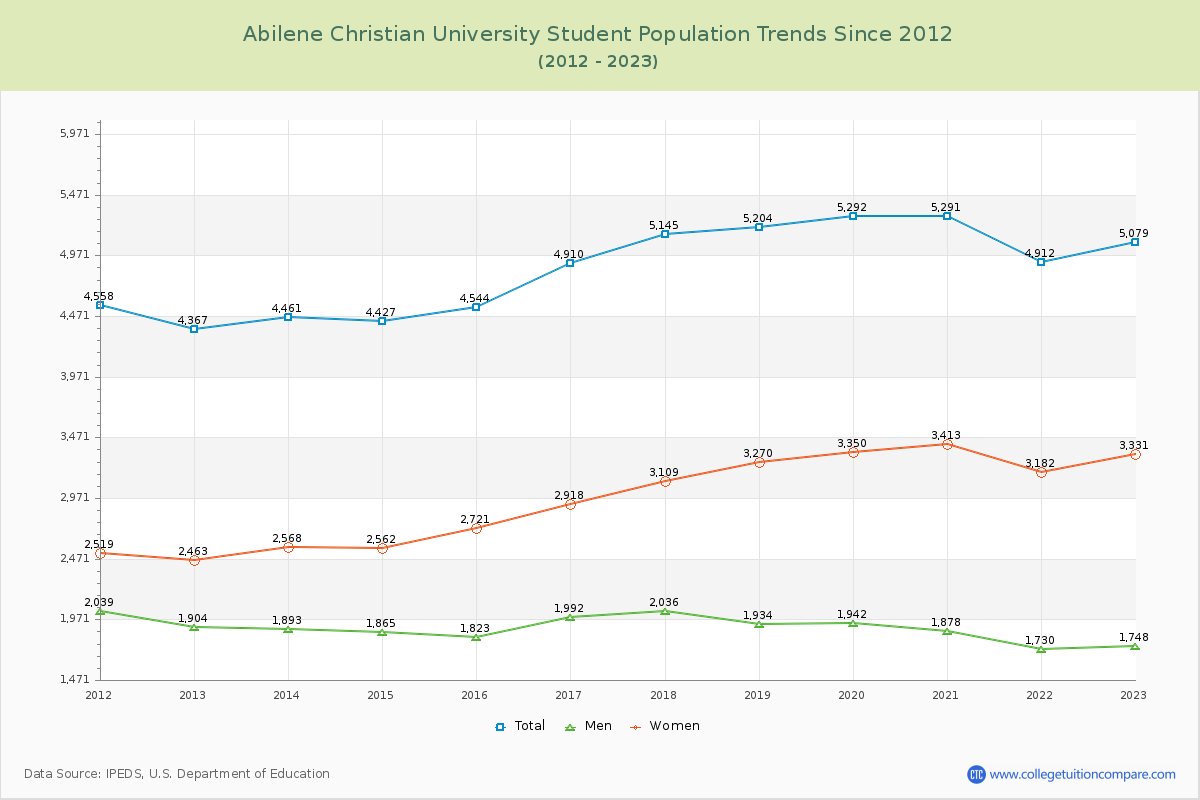
Student Population Changes
The average student population over the last 12 years is 4,876 where 5,079 students are attending the school for the academic year 2022-2023.
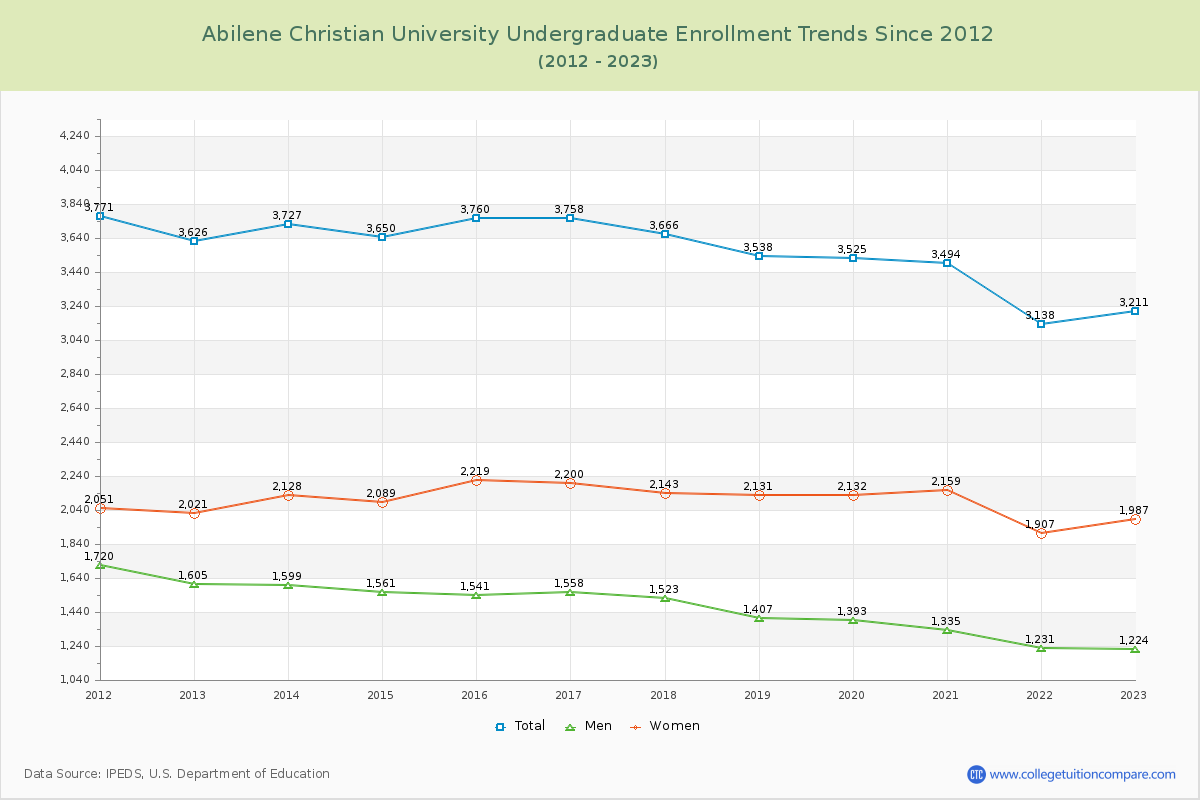
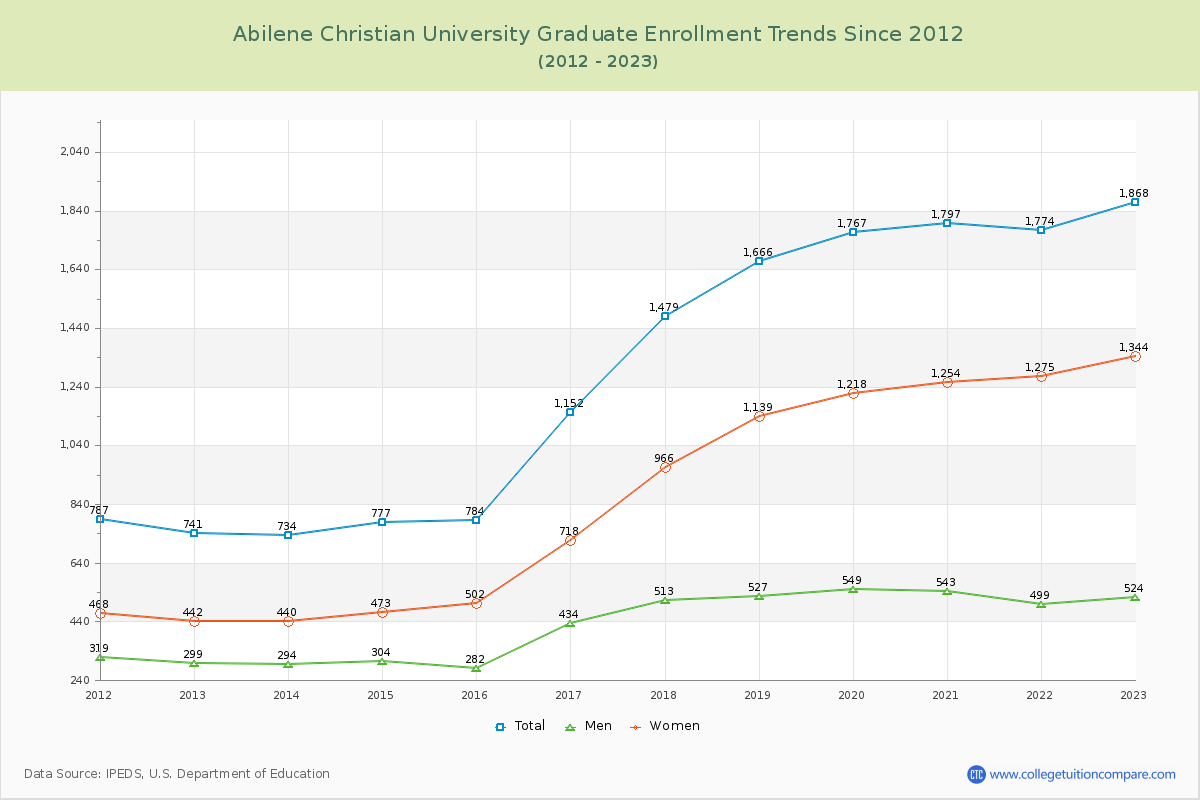
63.22% of total students is undergraduate students and 36.78% students is graduate students. The number of undergraduate students has decreased by 415 and the graduate enrollment has increased by 1,127 over past 10 years.
The female to male ratio is 1.91 to 1 and it means that there are more female students enrolled in Abilene Christian than male students.
The following table and chart illustrate the changes in student population by gender at Abilene Christian University since 2012.
| Year | Total | Undergraduate | Graduate | ||||
|---|---|---|---|---|---|---|---|
| Total | Men | Women | Total | Men | Women | ||
| 2012-13 | 4,367 | 3,626 | 1,605 | 2,021 | 741 | 299 | 442 |
| 2013-14 | 4,461 94 | 3,727 101 | 1,599 -6 | 2,128 107 | 734 -7 | 294 -5 | 440 -2 |
| 2014-15 | 4,427 -34 | 3,650 -77 | 1,561 -38 | 2,089 -39 | 777 43 | 304 10 | 473 33 |
| 2015-16 | 4,544 117 | 3,760 110 | 1,541 -20 | 2,219 130 | 784 7 | 282 -22 | 502 29 |
| 2016-17 | 4,910 366 | 3,758 -2 | 1,558 17 | 2,200 -19 | 1,152 368 | 434 152 | 718 216 |
| 2017-18 | 5,145 235 | 3,666 -92 | 1,523 -35 | 2,143 -57 | 1,479 327 | 513 79 | 966 248 |
| 2018-19 | 5,204 59 | 3,538 -128 | 1,407 -116 | 2,131 -12 | 1,666 187 | 527 14 | 1,139 173 |
| 2019-20 | 5,292 88 | 3,525 -13 | 1,393 -14 | 2,132 1 | 1,767 101 | 549 22 | 1,218 79 |
| 2020-21 | 5,291 -1 | 3,494 -31 | 1,335 -58 | 2,159 27 | 1,797 30 | 543 -6 | 1,254 36 |
| 2021-22 | 4,912 -379 | 3,138 -356 | 1,231 -104 | 1,907 -252 | 1,774 -23 | 499 -44 | 1,275 21 |
| 2022-23 | 5,079 167 | 3,211 73 | 1,224 -7 | 1,987 80 | 1,868 94 | 524 25 | 1,344 69 |
| Average | 4,876 | 3,554 | 1,452 | 2,101 | 1,322 | 433 | 888 |